* これは
* tl;dr
* では, どのくらい処理時間に差があるのか
— 調べてみました
— ruby-prof
— 標準の YAML ライブラリを ruby-prof で解析してみる
—– コード
—– 実行結果
— オレオレ YAML パーサーを ruby-prof で解析してみる
—– コード
—– 実行結果
* 以上
これは
qiita.com
初老丸 Advent Calendar 2018 第 4 日目の記事になる予定です.
tl;dr
前々回, 以下のような記事を書きました.
inokara.hateblo.jp
hub という Github クライアントライブラリの長い歴史の中で, Ruby 標準の YAML ライブラリの変わりにオレオレ YAML パーサーが実装されていて, そのパーサーで解析出来ない YAML ファイルを書いてハマってしまったという話です.
github.com
コミットメッセージから察するに, コマンドラインツールにおいて, 設定ファイルの YAML ファイルを読み込む時間は 1 ミリ秒でも速くしたかった思いが伺えます.
では, どのくらい処理時間に差があるのか
調べてみました
というのが本記事です. 本記事では以下のような環境で検証を行います.
$ sw_vers
ProductName:    Mac OS X
ProductVersion: 10.13.6
BuildVersion:   17G65

$ ruby --version
ruby 2.5.1p57 (2018-03-29 revision 63029) [x86_64-darwin17]
まず, 以下のようなスクリプトをこさえて雑に YAML ファイルを生成してみます.
require 'erb'

contents =<<"EOS"
github.com:
<%- (0..100000).each do |id| -%>
  - user: foobar<%= format('%04d', id) %>
    oauth_token: xxxxxxxxxxxxxxxxxxxxxxxxxxxxxxxxxxxxxxxxxxxxxxx<%= format('%04d', id) %>
<% end %>
EOS
erb = ERB.new(contents, nil, '-')
puts erb.result(binding).chomp
これを実行して YAML ファイルを生成します.
$ ruby generate-yaml.rb > sample.yml
以下のような無いようの YAML ファイルが生成されました.
github.com:
  - user: foobar0000
    oauth_token: xxxxxxxxxxxxxxxxxxxxxxxxxxxxxxxxxxxxxxxxxxxxxxx0000
  - user: foobar0001
    oauth_token: xxxxxxxxxxxxxxxxxxxxxxxxxxxxxxxxxxxxxxxxxxxxxxx0001
...
  - user: foobar99999
    oauth_token: xxxxxxxxxxxxxxxxxxxxxxxxxxxxxxxxxxxxxxxxxxxxxxx99999
  - user: foobar100000
    oauth_token: xxxxxxxxxxxxxxxxxxxxxxxxxxxxxxxxxxxxxxxxxxxxxxx100000
hub で利用する YAML ファイルのフォーマットそのままに 100000 ユーザー分のユーザー名 (user) とトークン (oauth_token) が生成されているはずです. (実際に 100000 ユーザー分を記載することは無いと思いますが…) これを sample.yml という名前で保存しておきます.
ruby-prof
調査には標準の profiler ライブラリではなく, ruby-prof という gem を利用しました.
github.com
profiler と ruby-prof の違いについては, ドキュメントや別の記事にお譲りしますが, ざっと使ってみた感じだと, プロファイルの実行速度や結果出力について profiler よりも優れているように思えます. ざっくりで恐縮ですが, ruby-prof の使い方は以下のように RubyProf.profile ブロック内に解析したいコードを差し込んで結果を RubyProf の各種プリンタクラスで表示します.
require 'yaml'
require 'ruby-prof'

result = RubyProf.profile do
  YAML.load_file('sample.yml')
end

printer = RubyProf::FlatPrinter.new(result)
printer.print(STDOUT, { :sort_method => :total_time })
上記の例だと, YAML.load_file('sample.yml') の解析結果が変数 result に格納され, RubyProf::FlatPrinter クラス (出力例はこちら) を使って結果を出力しています. 出力先として STDOUT に, total_time (対象のメソッドとそのメソッドから呼び出されたメソッドを含めた総処理時間) 順にソートされて出力します. 以下, 出力例です.
Measure Mode: wall_time
Thread ID: 70181951114860
Fiber ID: 70181959375120
Total: 0.119640
Sort by: total_time

 %self      total      self      wait     child     calls  name
  0.03      0.120     0.000     0.000     0.120        1   [global]#[no method]
  0.00      0.120     0.000     0.000     0.120        1   <Module::Psych>#load_file
  0.01      0.120     0.000     0.000     0.120        1   <Class::IO>#open
  0.01      0.119     0.000     0.000     0.119        1   <Module::Psych>#load
  0.00      0.066     0.000     0.000     0.066        1   <Module::Psych>#parse
...
尚, 出力は上記のテキスト出力だけではなく, HTML や graphviz で画像に書き出せる DOT 言語でも書き出すことが可能です. 詳細は README をご一読ください.
標準の YAML ライブラリを ruby-prof で解析してみる
コード
以下のようなコードで検証してみます.
require 'yaml'
require 'ruby-prof'

RubyProf::measure_mode = RubyProf::PROCESS_TIME
result = RubyProf.profile do
  YAML.load_file('sample.yml')
end

printer = RubyProf::FlatPrinter.new(result)
printer.print(STDOUT, { :sort_method => :self_time })
以下のように実行します.
$ bundle exec ruby parser1.rb > result1.txt
実行結果
以下のような結果となりました.
$ head -15 result1.txt
Measure Mode: process_time_time
Thread ID: 70238351920700
Fiber ID: 70238356042040
Total: 57.293642
Sort by: self_time

 %self      total      self      wait     child     calls  name
  7.07      5.715     4.050     0.000     1.665   400005   Psych::ScalarScanner#tokenize
  6.79      3.892     3.892     0.000     0.000   400005   Psych::Nodes::Scalar#initialize
  6.75      3.867     3.867     0.000     0.000   600014   Psych::TreeBuilder#event_location
  6.45     14.876     3.694     0.000    11.181   400005   Psych::TreeBuilder#scalar
  5.66     11.522     3.241     0.000     8.281   400005   Psych::Visitors::ToRuby#deserialize
  4.81     27.601     2.757     0.000    24.844        1   Psych::Parser#parse
  4.48      6.035     2.566     0.000     3.470   400005   Psych::TreeBuilder#set_location
  4.06      2.326     2.326     0.000     0.000   500009   Psych::TreeBuilder#set_start_location
... 以下略
処理時間は Total: を確認すると良さそうです. 約 57 秒掛かっていることが分かります. また, Psych::ScalarScanner#tokenize というメソッドが 400005 回コールされて, 4 秒程処理に要していることが分かります. 1 回のコールあたり 9 マイクロ秒の時間で処理されていることになります. この数字だけ見ると遅いという印象は特に感じません.
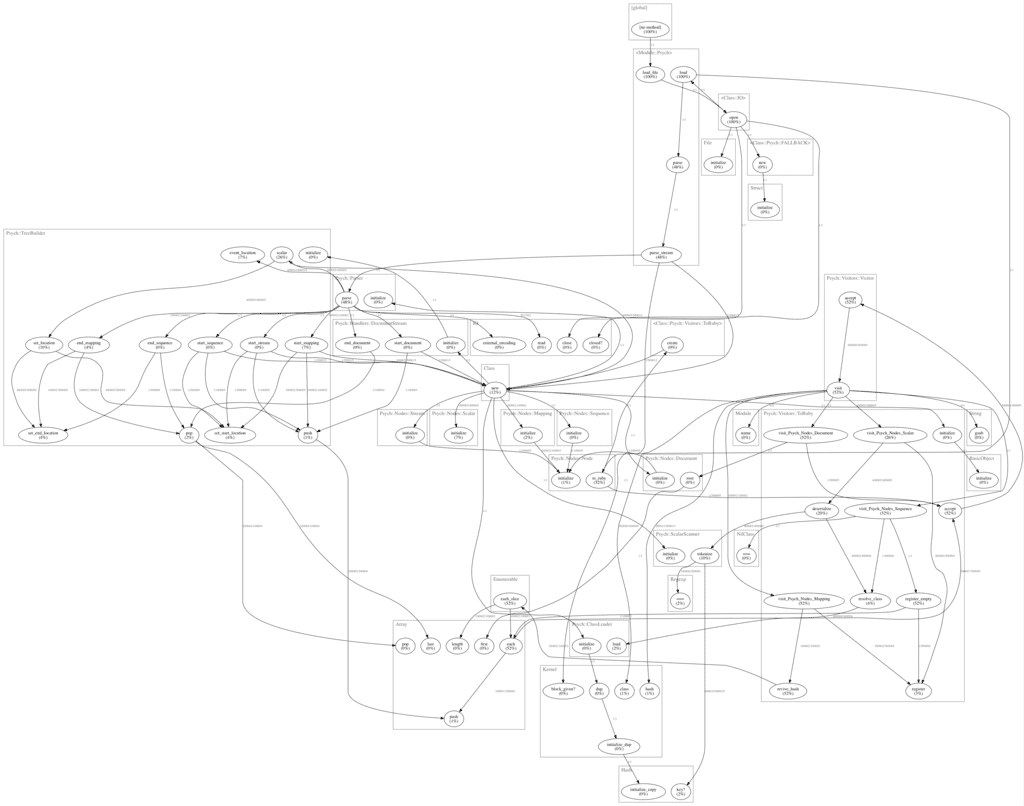
ただ, YAML が解析されるまでに非常に多くのメソッドが呼ばれていることが結果から読み取れます. これを ruby-prof を利用することで可視化することが可能です. 検証コードを以下のように修正して Graphviz で読み取れる DOT 言語で結果をプリントするようにします.
require 'yaml'
require 'ruby-prof'

RubyProf::measure_mode = RubyProf::PROCESS_TIME
result = RubyProf.profile do
  YAML.load_file('sample.yml')
end

printer = RubyProf::DotPrinter.new(result)
printer.print(STDOUT, { :sort_method => :self_time })
以下のように実行して, Graphviz で画像に変換してみます. (事前に Graphviz をインストールしておきます.)
$ bundle exec ruby parser1.rb > result1.dot
$ dot -Tpng result1.dot -o result1.png
$ open result1.png
以下のように多くのメソッドが呼ばれていることが解ります. すごい.
オレオレ YAML パーサーを ruby-prof で解析してみる
コード
以下のようなコードで検証してみます.
require 'yaml'
require 'ruby-prof'

def yaml_load(string)
  hash = {}
  host = nil
  string.split("\n").each do |line|
    case line
    when /^---\s*$/, /^\s*(?:#|$)/
      # ignore
    when /^(.+):\s*$/
      host = hash[$1] = []
    when /(^[- ]) (.+?): (.+)/
      key, value = $2, $3
      host << {} if $1 == '-' or $2 =~ /^\s*-\s*/
      key.gsub!(/^\s*-\s*|^\s*/, '')
      # require 'byebug'; byebug
      host.last[key] = value.gsub(/^'|'$/, '')
    else
      raise "unsupported YAML line: #{line}"
    end
  end
  hash
end

RubyProf::measure_mode = RubyProf::PROCESS_TIME
result = RubyProf.profile do
  File.open("sample.yml", "r") do |f|
    yaml_load(f.read)
  end
end

printer = RubyProf::FlatPrinter.new(result)
printer.print(STDOUT, {})
以下のように実行します.
$ bundle exec ruby parser2.rb > result2.txt
実行結果
以下のような結果となりました.
$ cat result2.txt
Measure Mode: process_time_time
Thread ID: 70351828807260
Fiber ID: 70351829107000
Total: 7.317221
Sort by: self_time

 %self      total      self      wait     child     calls  name
 49.76      7.242     3.641     0.000     3.601        1   Array#each
 27.34      2.001     2.001     0.000     0.000   800011   Regexp#===
 12.90      0.944     0.944     0.000     0.000   200002   String#gsub!
  5.46      0.400     0.400     0.000     0.000   200002   String#gsub
  3.50      0.256     0.256     0.000     0.000   200002   Array#last
  0.91      0.067     0.067     0.000     0.000        1   String#split
  0.12      0.009     0.009     0.000     0.000        1   IO#read
  0.00      0.000     0.000     0.000     0.000        1   File#initialize
  0.00      7.317     0.000     0.000     7.317        1   [global]#[no method]
  0.00      7.317     0.000     0.000     7.317        1   <Class::IO>#open
  0.00      7.308     0.000     0.000     7.308        1   Object#yaml_load
  0.00      0.000     0.000     0.000     0.000        1   IO#close
  0.00      0.000     0.000     0.000     0.000        1   IO#closed?

* indicates recursively called methods
トータルの処理時間は 7.3 秒. Regex クラスの === メソッドが 800011 回コールされていることが分かります. === メソッドは左辺と右辺の String を正規表現マッチするメソッドなので, オレオレ YAML パーサーでは愚直に文字列比較を行って YAML を解析していると思われます. 処理時間は YAML ライブラリの 8 倍程度速く処理出来ていますので, hub の作者が嘆いていた理由は分かりました.
一応, YAML ライブラリと同様に, 呼ばれているメソッドを可視化したところ, 以下の通りとなりました.
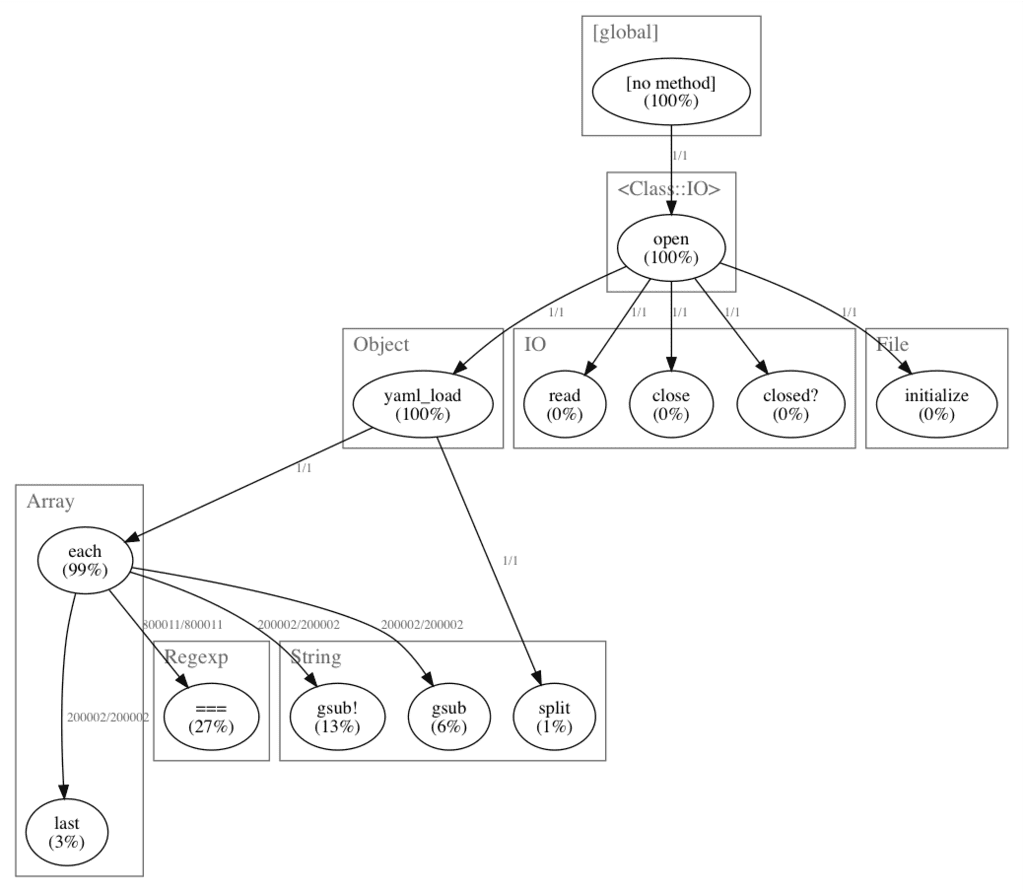
YAML ライブラリと比較すると実にシンプルであることが分かりました.
以上
YAML ライブラリと hub で実装されていたオレオレ YAML パーサーの処理時間の比較を通して, ruby-prof を用いて, どのような処理が行われているかを把握し, 可視化することが出来ました.
速度を比較した結果は YAML ライブラリの方がオレオレ YAML パーサーよりも処理時間が長くなりましたが, これを一概に遅いと言えないと思いますし, 多くのメソッドが呼ばれるにはそれなりの意味があると考えています.
今回はこれ以上は踏み込んで調査は行いませんが, 機会があれば YAML ライブラリのソースコードをちゃんと読んで理解を深めたいと思います.
有難うございました.
元記事はこちら
「Ruby の YAML ライブラリで YAML をパースする vs オレオレ YAML パーサーで YAML をパースする 〜 この戦いは止むる (YAML) ことは出来ない 〜」