      Date & Time,  Trans,  Elap Time,  Data Trans,  Resp Time,  Trans Rate,  Throughput,  Concurrent,    OKAY,   Failed
2014-08-26 04:43:48,   4440,      17.14,           1,       0.32,      259.04,        0.06,       83.42,    4440,       0
そしてこのログを以下のような fluentd の設定で監視しちゃいます。
siege.conf
  type tail
  path /tmp/siege_log
  pos_file /tmp/test.pos
  tag siege.access
  format /^(?(d{4})-(d{2})-(d{2}) (d{2}:)(d{2}):(d{2})),s{0,}(?d+(.d+)?),s{0,}(?d+(.d+)?),s{0,}(?d+(.d+)?),s{0,}(?d+(.d+)?),s{0,}(?d+(.d+)?),s{0,}(?d+(.d+)?),s{0,}(?d+(.d+)?),s{0,}(?d+),s{0,}(?d+)$/
  time_format %Y-%m-%d %H:%M:%S


  type copy

    type forward

      host xxx.xxx.xxx.xxx
      port 24224


    type file
    path /tmp/siege_log.parsed
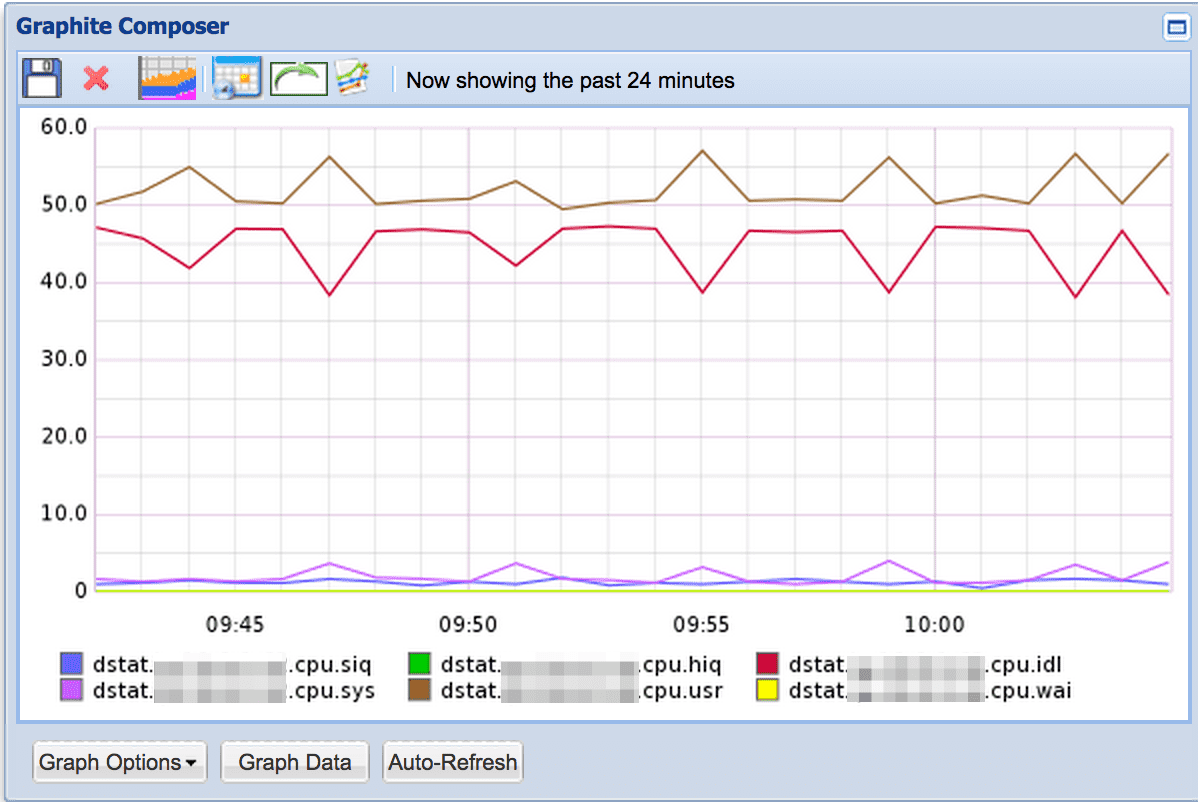
type dstat
tag dstat
option -d -lcm --tcp
delay 3
type forest
subtype copy
type map
tag "dstat.${hostname}.cpu"
time time
record record['dstat']['total cpu usage']
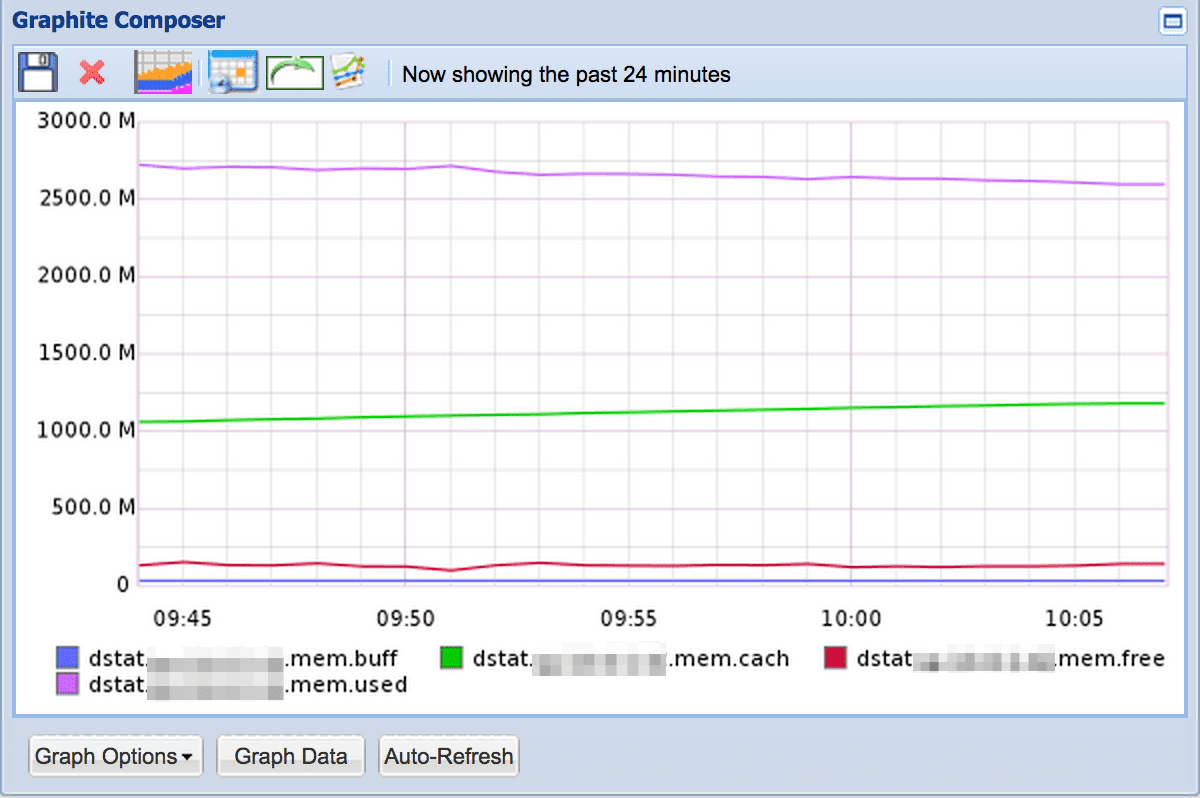
type map
tag "dstat.${hostname}.mem"
time time
record record['dstat']['memory usage']
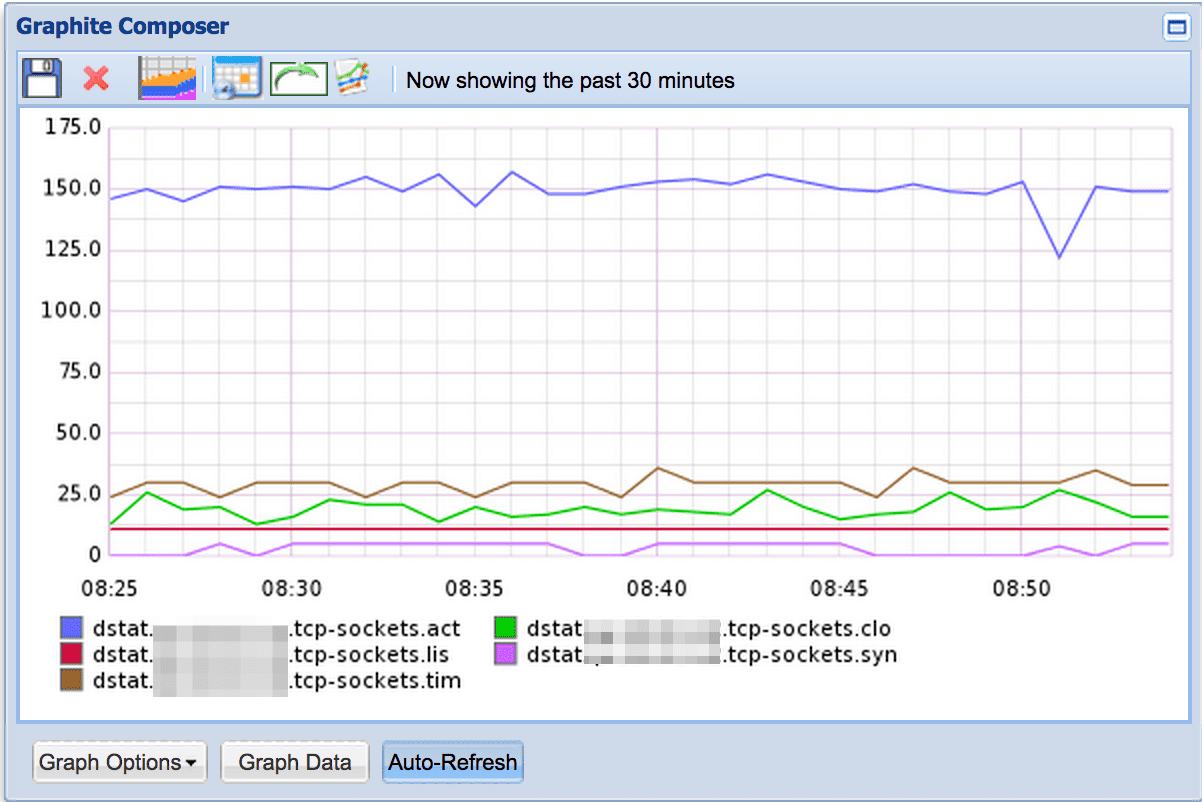
type map
tag "dstat.${hostname}.tcp-sockets"
time time
record record["dstat"]["tcp sockets"]
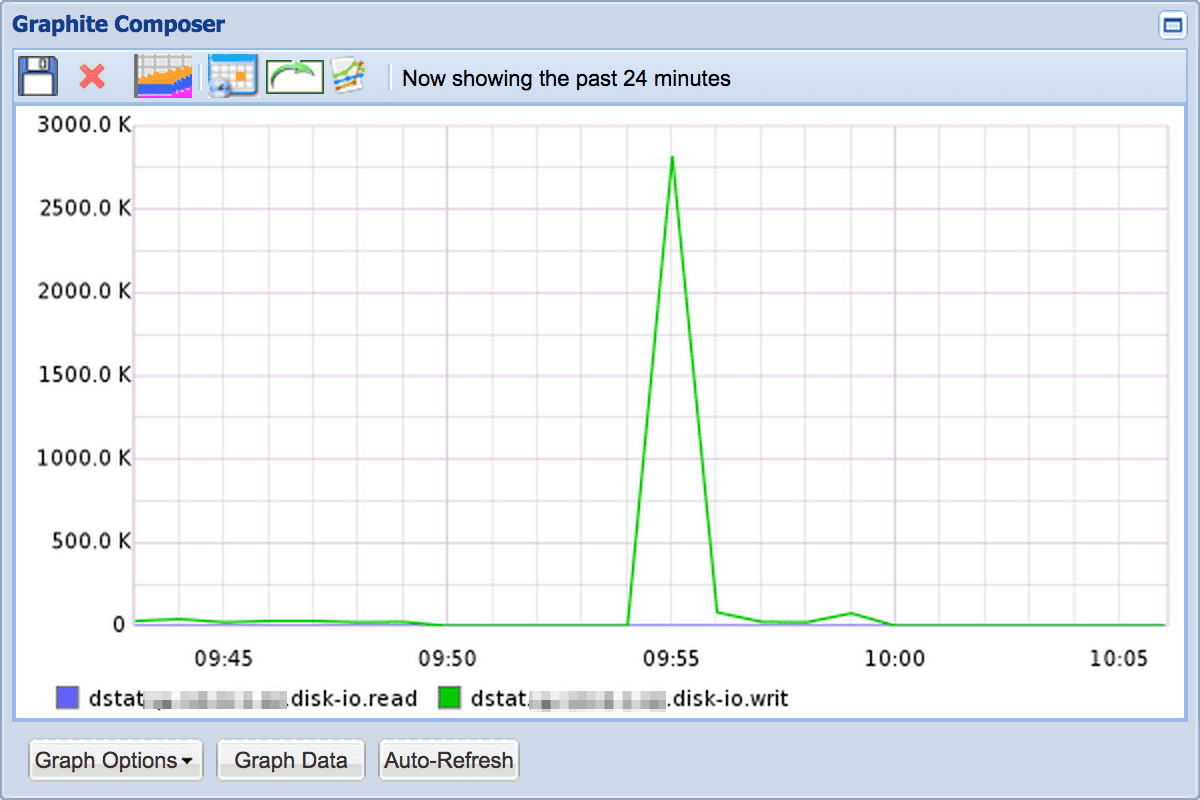
type map
tag "dstat.${hostname}.disk-io"
time time
record record["dstat"]["dsk/total"]
type forward
buffer_type file
buffer_path /tmp/fluent.dstat.buffer
retry_wait 30s
retry_limit 5
flush_at_shutdown true
host xxx.xxx.xxx.xxx
port 24224
  type forward
  port 24224
  bind 0.0.0.0


  type copy

      type  stdout


      type graphite
      host localhost
      port 2003
      tag_for prefix
      name_keys usr,sys,idl,wai,hiq,siq


  type copy

      type  stdout


      type graphite
      host localhost
      port 2003
      tag_for prefix
      name_keys lis,act,syn,tim,clo


  type copy

      type  stdout


      type graphite
      host localhost
      port 2003
      tag_for prefix
      name_keys read,writ


  type copy

      type  stdout


      type graphite
      host localhost
      port 2003
      tag_for prefix
      name_keys used,buff,cach,free


  type forest
  subtype copy


      type  growthforecast
      gfapi_url http://127.0.0.1:5125/api/
      service ${tag_parts[0]}
      tag_for section
      name_key_pattern .*


      type graphite
      host localhost
      port 2003
      key_prefix siege.${tag_parts[0]}
      name_keys Trans,Elap_Time,Data_Trans,Resp_Time,Trans_Rate,Throughput,Concurrent,OKAY,Failed