
ども、cloudpack の かっぱ (@inokara) です。
目的(やりたいこと)
- コマンドラインから Apache の設定や状態を確認したい
- イメージとしては MySQL の show variables で設定パラメータは show statsu で現在の状態が確認出来るようなものが Apache にもないかしら
避けては通れない mod_status
当初は mod_status に頼らない方法を模索していましたが無理そうなので mod_status を有効にしつつ以下のように mod_status の設定。
Listen 8000 (snip) ExtendedStatus OnSetHandler server-status Order deny,allow Deny from all Allow from 127.0.0.1
fullstatus
links が必要
標準では fullstatus サブコマンドが利用可能。但し、fullstatus を実行する際には links というテキストブラウザが必要。
$ sudo service httpd fullstatus
The 'links' package is required for this functionality.
テキストブラウザが必要か…この時点でやりたい事から乖離してきているが取り敢えず試したいので links をインストール。
sudo yum install links
httpd fullstatus
以下のように実行。
service httpd fullstatus
以下のように出力される。
                       Apache Server Status for localhost

   Server Version: Apache/2.2.29 (Unix) DAV/2 PHP/5.3.29

   Server Built: Sep 15 2014 19:41:41

   --------------------------------------------------------------------------

   Current Time: Tuesday, 03-Feb-2015 00:32:08 UTC

   Restart Time: Monday, 02-Feb-2015 14:16:55 UTC

   Parent Server Generation: 0

   Server uptime: 10 hours 15 minutes 13 seconds

   Total accesses: 30827 - Total Traffic: 1.4 MB

   CPU Usage: u5.59 s2.05 cu0 cs0 - .0207% CPU load

   .835 requests/sec - 39 B/second - 47 B/request

   3 requests currently being processed, 4 idle workers

 W_RR___.........................................................
 ................................................................
 ................................................................
 ................................................................

   Scoreboard Key:
   "_" Waiting for Connection, "S" Starting up, "R" Reading Request,
   "W" Sending Reply, "K" Keepalive (read), "D" DNS Lookup,
   "C" Closing connection, "L" Logging, "G" Gracefully finishing,
   "I" Idle cleanup of worker, "." Open slot with no current process

Srv  PID      Acc     M CPU  SS  Req Conn Child Slot  Client                VHost                 Request
                                                                                               GET
0-0 13094 0/3825/3825 W 1.53 0   0   0.0  0.17  0.17 127.0.0.1 ip-xxx-xx-x-xxx.ap-northeast-1. /server-status
                                                                                               HTTP/1.1
1-0 26635 0/92/3971   _ 0.03 0   0   0.0  0.04  0.17 127.0.0.1 ip-xxx-xx-x-xxx.ap-northeast-1. GET /index.php
                                                                                               HTTP/1.0
2-0 26664 0/49/3915   R 0.02 8   0   0.0  0.02  0.16 ?         ?                               ..reading..
3-0 13097 0/3826/3826 R 1.52 8   0   0.0  0.19  0.19 ?         ?                               ..reading..
4-0 26765 0/36/3884   _ 0.01 3   0   0.0  0.00  0.19 127.0.0.1 ip-xxx-xx-x-xxx.ap-northeast-1. GET /index.php
                                                                                               HTTP/1.0
5-0 13099 0/3813/3813 _ 1.52 1   0   0.0  0.18  0.18 127.0.0.1 ip-xxx-xx-x-xxx.ap-northeast-1. GET /index.php
                                                                                               HTTP/1.0
6-0 13100 0/3735/3735 _ 1.48 3   0   0.0  0.16  0.16 127.0.0.1 ip-xxx-xx-x-xxx.ap-northeast-1. GET /index.php
                                                                                               HTTP/1.0
                                                                                               GET
7-0 -     0/0/3858    . 1.53 524 0   0.0  0.00  0.18 127.0.0.1 ip-xxx-xx-x-xxx.ap-northeast-1. /server-status
                                                                                               HTTP/1.0

   --------------------------------------------------------------------------

    Srv  Child Server number - generation
    PID  OS process ID
    Acc  Number of accesses this connection / this child / this slot
     M   Mode of operation
    CPU  CPU usage, number of seconds
    SS   Seconds since beginning of most recent request
    Req  Milliseconds required to process most recent request
   Conn  Kilobytes transferred this connection
   Child Megabytes transferred this child
   Slot  Total megabytes transferred this slot

   --------------------------------------------------------------------------

    Apache/2.2.29 (Amazon) Server at localhost Port 80
おお。ブラウザで見るの似ている。
apache-top
ちょっと期待の…
apache-top という Python 製のツールを見つけたので試す。
インストールは Python ファイルをダウンロードしてくるだけ。
wget https://raw.githubusercontent.com/fr3nd/apache-top/master/apache-top.py
起動
以下のように server-status の URL を指定して起動。
./apache-top.py -u http://localhost:8000/server-status
以下のように出力される。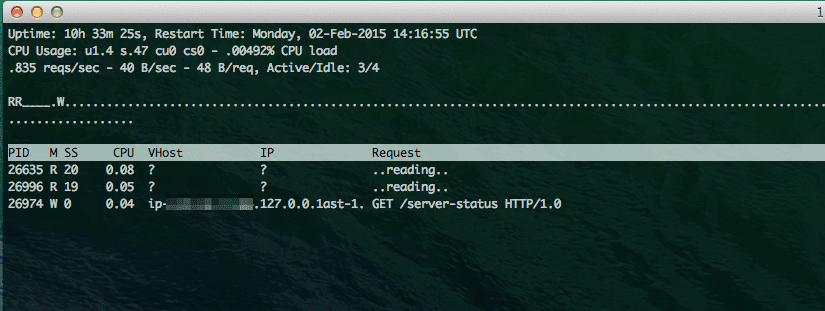
おお、まさに top 画面。
q を押すと top 画面は終了する。前後が逆になったがオプションは以下の通り。
$ ./apache-top.py -h
Shows the actual status of the Apache web server using the server-status
url. It needs the ExtendedStatus flag

    Usage: apache-top [-s] -u url
        -u url    Url where apache-status is located
                  Example: apache-top.py -u http://www.domain.com/server-status
        -s        Show scoreboard


    Interactive keys:
        q       Exit
        P       Sort by PID
        C       Sort by CPU usage
        S       Sort by Seconds since beginning of most recent request
        V       Sort by VirtualHost
        M       Sort by Mopde of operation
        R       Sort by Request
        I       Sort by Ip
        s       Show/Hide mod_status scoreboard
        a       Switch between show all processes and show only active processes (default)
        r       Reverse sort
IP アドレスや VirtualHost 毎のソートが可能。
こんなんもあった…
Apache GUI
おまけ程度で大変恐縮だが Apache GUI というツールもある。この Apache GUI はざっと見た感じだとアクセスログの検索、設定ファイルの編集、Apache の再起動等も行えるという、何とも優れも(怖い)ツール。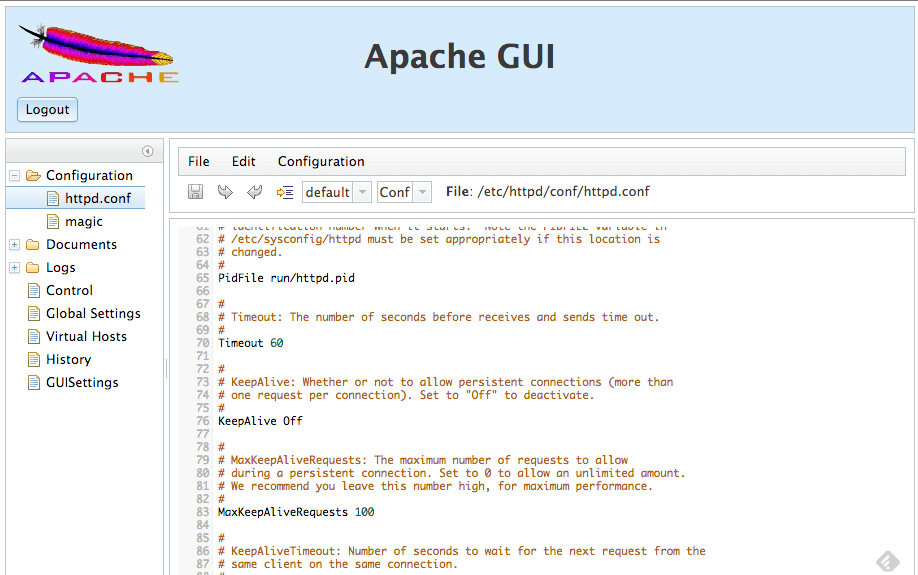
tomcat で実装されており Apache の設定をや状態を GUI で管理出来る。
セットアップから起動は簡単。
cd ~/src
wget http://jaist.dl.sourceforge.net/project/apachegui/1.9%20Linux-Solaris-Mac/ApacheGUI-1.9.6.tar.gz
tar zxvf ApacheGUI-1.9.6.tar.gz
cd ApacheGUI/bin/
# 実行
sudo ./run.sh
実行したらブラウザで http://${host}:9999/ApacheGUI にアクセスするとログイン画面で認証情報を入力した後、以下のように Apache の各種情報を入力する画面が表示される。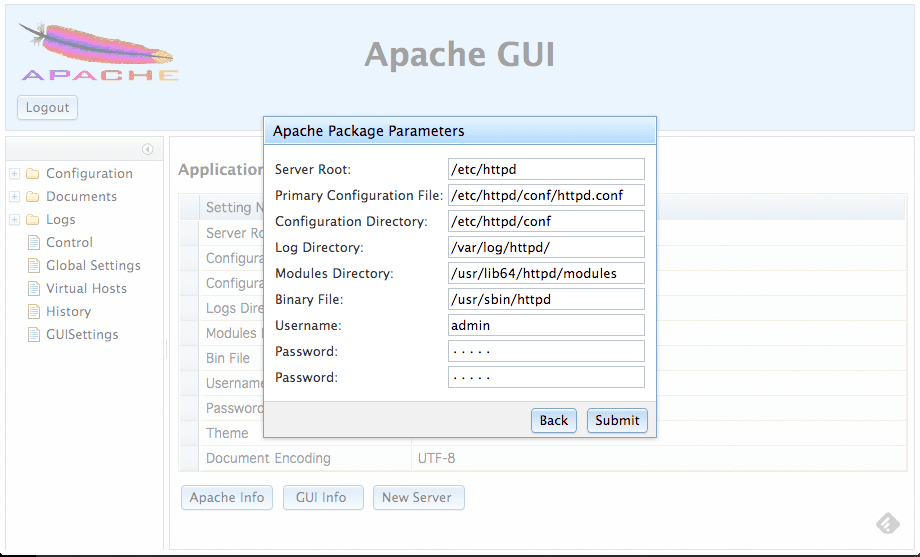
全部入力しないと怒られるので注意。上記の例は RPM パッケージでインストールした Apache の場合。
とりあえず、今回のやりたい事とは違うので Apache GUI についてはココまで。
ということで…
今回得た知見は以下の通り。
- Apache の内部情報を知るためには mod_status の設定は必要
- mod_status の設定を行えば
service httpd fullstatusで情報は確認することは出来る - apache-top という Python 製のツールがある
- Apache GUI というツールもある
- 設定情報は httpd.conf から確認するしか無さそう
お疲れ様でした。
元記事はこちらです。
「俺の知見 – Apache にあんまり手を加えずに内部情報モニタリングする方法を探したメモ」