
Sensu について復習してみたいと思う。
ということで…
復習環境に Grafana 2.0 を導入した際のメモ。
Grafana とは
サイト
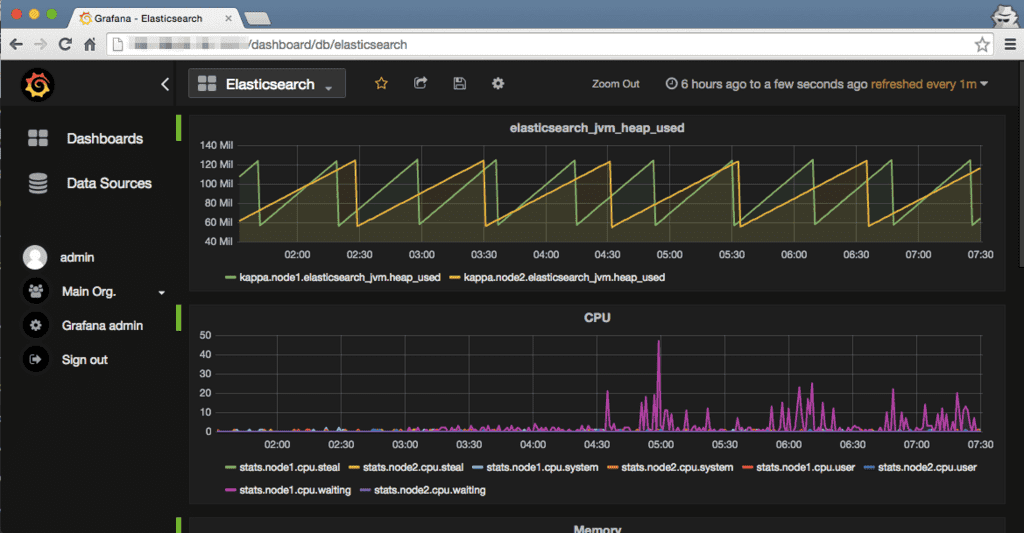
スクショ
説明下手なのでスクショ一枚で。
三行で
- Graphite 等の時系列データベースに蓄積されたメトリクスを綺麗に見せるダッシュボード
- Sensu でメトリクス見るならほぼ標準
- 導入はとても簡単(でした)
サポートする時系列データベース
上記以外にも KariosDB や SQL も実験的にサポートされるようだ。 尚、 Elasticsearch もサポートされているが、実際に試してみたところ手元の環境で Elasticsearch のメトリクスを Grafana に表示することは出来なかった(多分、自分のやり方が悪い)ので引き続き試す。(※もしかしたら Elasticsearch をサポートしているのはダッシュボードを管理している部分だけなのかもしれない…)
2.0 にて追加された機能
What’s New in Grafana v2.0 – Grafana Documentation
上記に纏まっているものをザクっと要約。
- 独自のバックエンドデータベースが追加
- バックエンドデータベースへの接続をプロキシするようになり CROS も気にする必要が無い
- 三種類(閲覧、編集、管理者)の権限をユーザー又は組織に対して付与出来るようになった
- ダッシュボード共有機能の強化(スナップショットの共有、共有の期限等)
- パネル毎に時系列を設定出来るようになった
- raintank との連携
上記以外でも Grafana 自体がパッケージ化されたことにより各ディストリビューション毎のパッケージ管理ツールで導入することが出来るようにもなっている。
ということで…導入
参考
Installation – Grafana Documentation
今回は VirtualBox 上の CentOS 6.4 にインストールする。
yum リポジトリの追加
/etc/yum.repos.d/grafana.repo を以下のように作成。
[grafana]
name=grafana
baseurl=https://packagecloud.io/grafana/stable/el/6/$basearch
repo_gpgcheck=1
enabled=1
gpgcheck=1
gpgkey=https://packagecloud.io/gpg.key https://grafanarel.s3.amazonaws.com/RPM-GPG-KEY-grafana
sslverify=1
sslcacert=/etc/pki/tls/certs/ca-bundle.crt
yum install
sudo yum install grafana
以上。
起動
sudo service grafana
以上。
尚、デフォルトではポート 3000 番で Listen するので、残念ながら Uchiwa と同居する場合にはどちらかのポートを変えなければいけないということに気づくはず…。Grafana のポート変更を行う場合には /etc/grafana/grafana.ini の設定にて変更を行う。(設定については別途)
早速、ブラウザでアクセスすると以下のようなログイン画面となる。
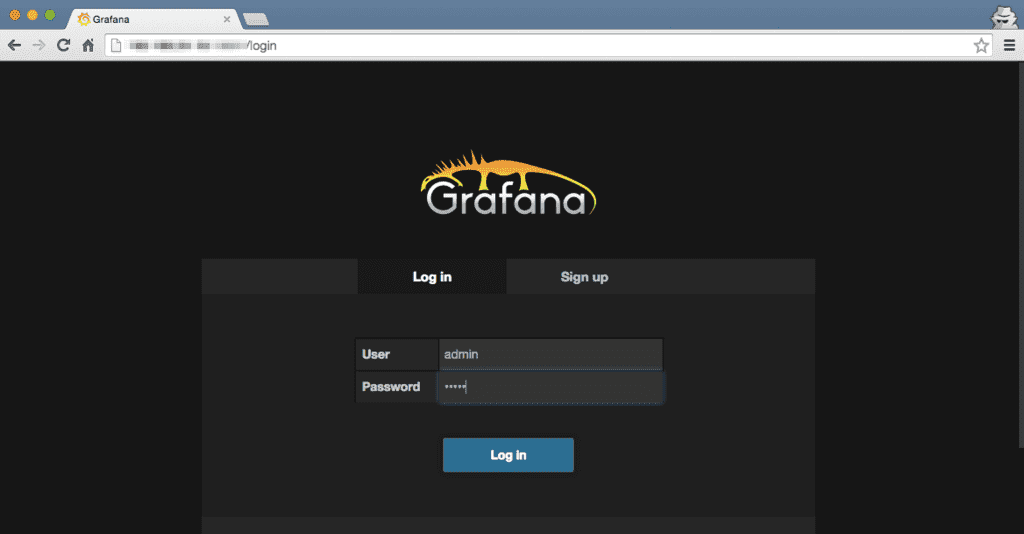
デフォルトの認証情報はユーザー名、パスワード共に admin となるので、ログインを確認したら変更しておく。
設定
Grafana 自体の設定は /etc/grafana/grafana.ini にて行う。
##################### Grafana Configuration Example ##################### # # Everything has defaults so you only need to uncomment things you want to # change ; app_mode = production #################################### Paths #################################### [paths] # Path to where grafana can store temp files, sessions, and the sqlite3 db (if that is useD) # ;data = /var/lib/grafana # # Directory where grafana can store logs # ;logs = /var/log/grafana #################################### Server #################################### [server] # Protocol (http or https) ;protocol = http # The ip address to bind to, empty will bind to all interfaces ;http_addr = # The http port to use http_port = 3001 # The public facing domain name used to access grafana from a browser ;domain = localhost # The full public facing url ;root_url = %(protocol)s://%(domain)s:%(http_port)s/ # Log web requests ;router_logging = false # the path relative working path ;static_root_path = public # enable gzip ;enable_gzip = false # https certs & key file ;cert_file = ;cert_key = #################################### Database #################################### [database] # Either "mysql", "postgres" or "sqlite3", it's your choice ;type = sqlite3 ;host = 127.0.0.1:3306 ;name = grafana ;user = root ;password = # For "postgres" only, either "disable", "require" or "verify-full" ;ssl_mode = disable # For "sqlite3" only, path relative to data_path setting ;path = grafana.db #################################### Session #################################### [session] # Either "memory", "file", "redis", "mysql", default is "memory" ;provider = file # Provider config options # memory: not have any config yet # file: session dir path, is relative to grafana data_path # redis: config like redis server addr, poolSize, password, e.g. `127.0.0.1:6379,100,grafana` # mysql: go-sql-driver/mysql dsn config string, e.g. `user:password@tcp(127.0.0.1)/database_name` ;provider_config = sessions # Session cookie name ;cookie_name = grafana_sess # If you use session in https only, default is false ;cookie_secure = false # Session life time, default is 86400 ;session_life_time = 86400 #################################### Analytics #################################### [analytics] # Server reporting, sends usage counters to stats.grafana.org every 24 hours. # No ip addresses are being tracked, only simple counters to track # running instances, dashboard and error counts. It is very helpful to us. # Change this option to false to disable reporting. ;reporting_enabled = true # Google Analytics universal tracking code, only enabled if you specify an id here ;google_analytics_ua_id = #################################### Security #################################### [security] # default admin user, created on startup ;admin_user = admin # default admin password, can be changed before first start of grafana, or in profile settings ;admin_password = admin # used for signing ;secret_key = SW2YcwTIb9zpOOhoPsMm # Auto-login remember days ;login_remember_days = 7 ;cookie_username = grafana_user ;cookie_remember_name = grafana_remember #################################### Users #################################### [users] # disable user signup / registration ;allow_sign_up = true # Allow non admin users to create organizations ;allow_org_create = true # Set to true to automatically assign new users to the default organization (id 1) ;auto_assign_org = true # Default role new users will be automatically assigned (if disabled above is set to true) ;auto_assign_org_role = Viewer #################################### Anonymous Auth ########################## [auth.anonymous] # enable anonymous access ;enabled = false # specify organization name that should be used for unauthenticated users ;org_name = Main Org. # specify role for unauthenticated users ;org_role = Viewer #################################### Github Auth ########################## [auth.github] ;enabled = false ;client_id = some_id ;client_secret = some_secret ;scopes = user:email ;auth_url = https://github.com/login/oauth/authorize ;token_url = https://github.com/login/oauth/access_token ;api_url = https://api.github.com/user # Uncomment bellow to only allow specific email domains ; allowed_domains = mycompany.com othercompany.com #################################### Google Auth ########################## [auth.google] ;enabled = false ;client_id = some_client_id ;client_secret = some_client_secret ;scopes = https://www.googleapis.com/auth/userinfo.profile https://www.googleapis.com/auth/userinfo.email ;auth_url = https://accounts.google.com/o/oauth2/auth ;token_url = https://accounts.google.com/o/oauth2/token ;api_url = https://www.googleapis.com/oauth2/v1/userinfo # Uncomment bellow to only allow specific email domains ; allowed_domains = mycompany.com othercompany.com #################################### Logging ########################## [log] # Either "console", "file", default is "console" # Use comma to separate multiple modes, e.g. "console, file" ;mode = console, file # Buffer length of channel, keep it as it is if you don't know what it is. ;buffer_len = 10000 # Either "Trace", "Debug", "Info", "Warn", "Error", "Critical", default is "Trace" ;level = Info # For "console" mode only [log.console] ;level = # For "file" mode only [log.file] ;level = # This enables automated log rotate(switch of following options), default is true ;log_rotate = true # Max line number of single file, default is 1000000 ;max_lines = 1000000 # Max size shift of single file, default is 28 means 1上記の通り、全文掲載。
英語がダメダメな自分でもドキュメントから読み取れない機能や設定は設定ファイルを見ると判るのがせめてもの救いだが、先述のポート番号変更は
http_portを修正する。また、Github や Google の認証への対応や AMQP を使ったイベントの配信等もサポートしているようだ(何に使うんだ...)。ハンズオン
やること
せっかくなのでハンズオンしてみたい。
- データソース(データベース)の登録
- メトリクスの登録
- ダッシュボードの共有機能を試す
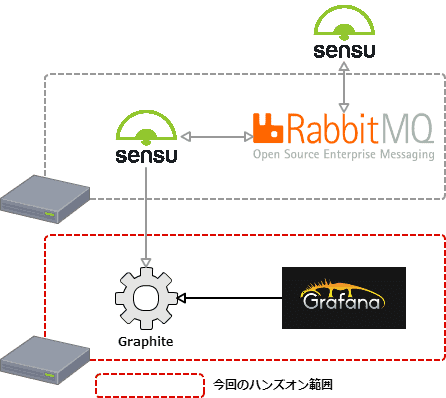
尚、ハンズオンの環境は下記の通り、Sensu から Graphite に送られてくるメトリクスを利用してダッシュボードを作成して共有してみる。
データソース(データベース)の登録
詳細はドキュメントを。
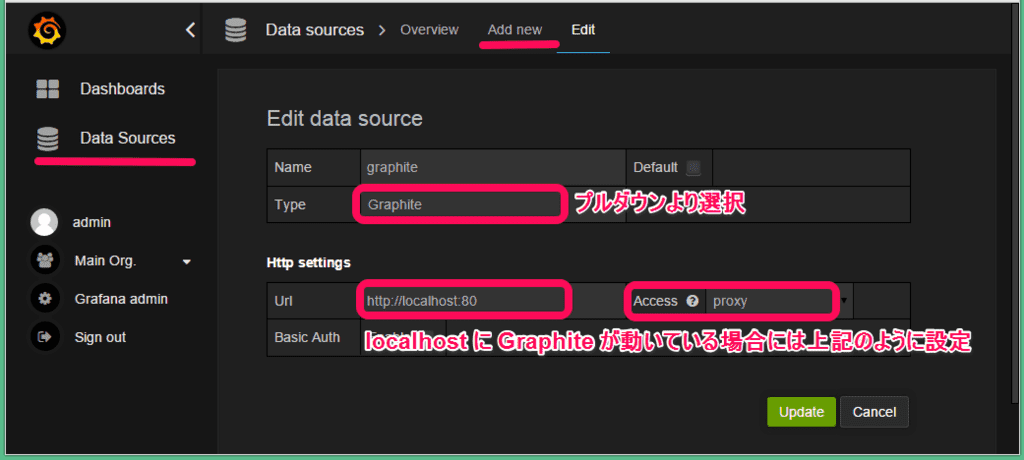
- Data Source メニューから
Add newをクリックして登録する TypeからGraphiteを選択Urlにはhttp://localhost:80を記載しAccessはProxyを選択する
尚、Access には Proxy と Direct があり、違いについては以下の通り。
Proxyは Grafana Backend を介したアクセスDirectはブラウザから直接アクセス(2.0 以前の接続方法だったはず...)
メトリクスの登録(1)
Graph パネルにメトリクスを登録してみる。 詳細はドキュメントを。
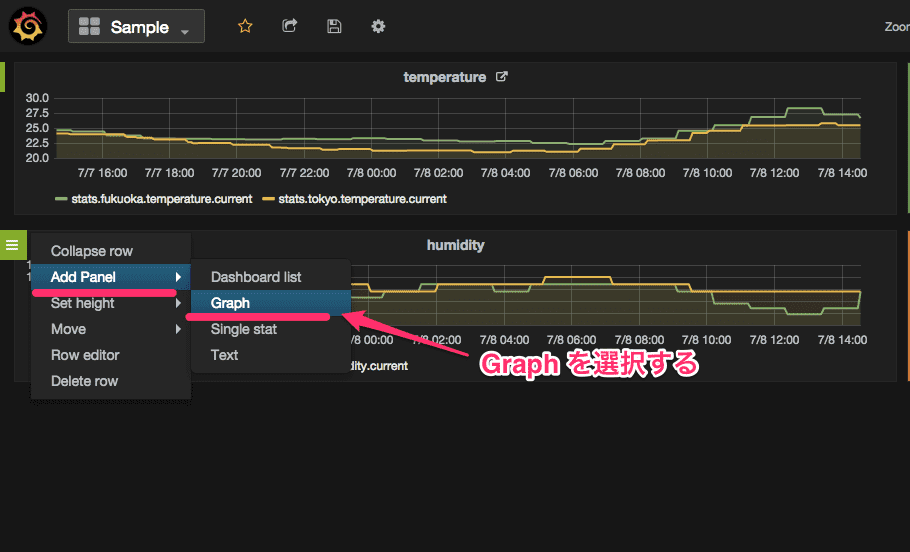
ADD ROW をクリックして Row を追加、引き続き、Add Panel から Graph をクリックする。
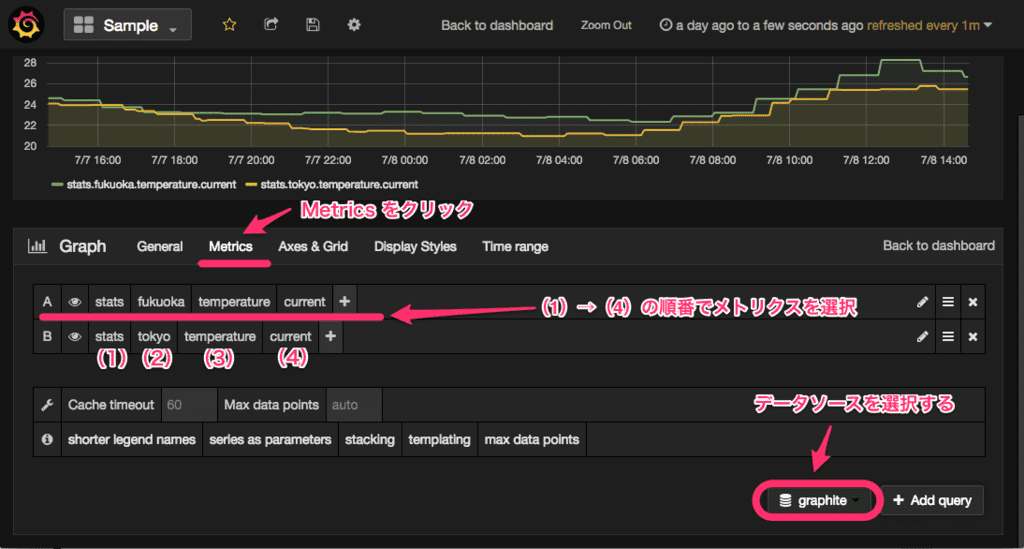
Metrics タブをクリックして必要なメトリクスをプルダウンで選択していく。
メトリクスの登録(2)
Singlestat パネルにメトリクスを登録してみる。 詳細はドキュメントを。
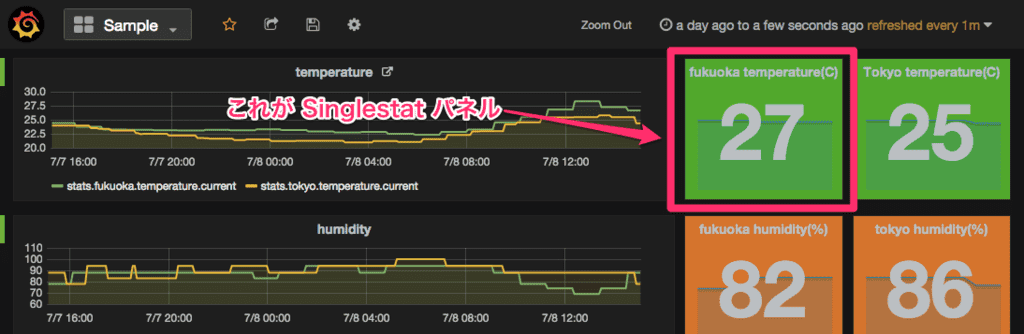
上図のように時系列データではなく、ある時点の値や合計値、平均値等を表示することが出来る。
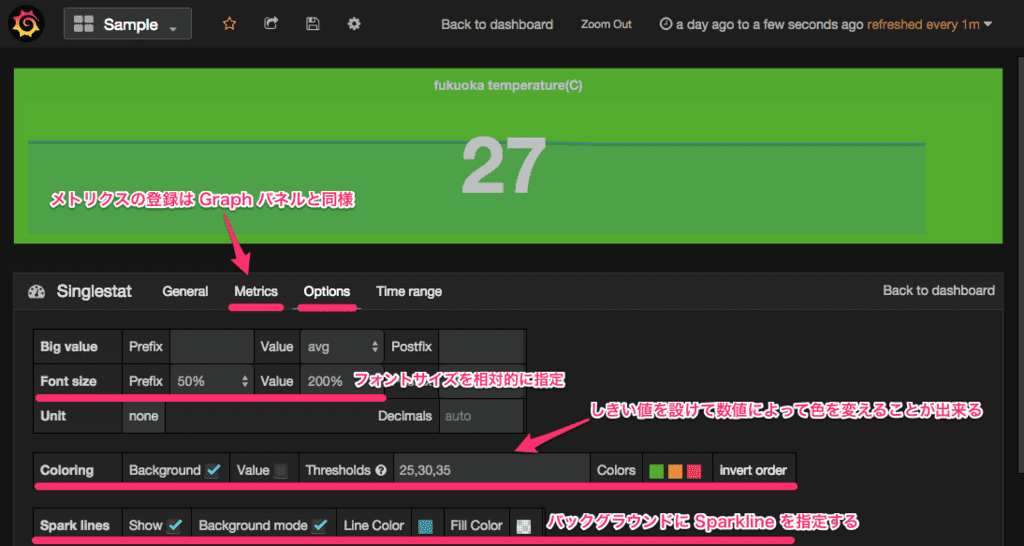
メトリクスの登録については Graph パネルと同様にデータソースを指定してメトリクスを選択し、Options タブにて平均値や合計値等を指定する。また、しきい値を設けることで値によって色を付ける事も出来る。
ダッシュボードの共有機能を試す
実際の運用でダッシュボードを共有することがあるか(ニーズがあるか)判らないが...Share Dashboard をクリックすると以下のようにダッシュボードのリンクが表示される。
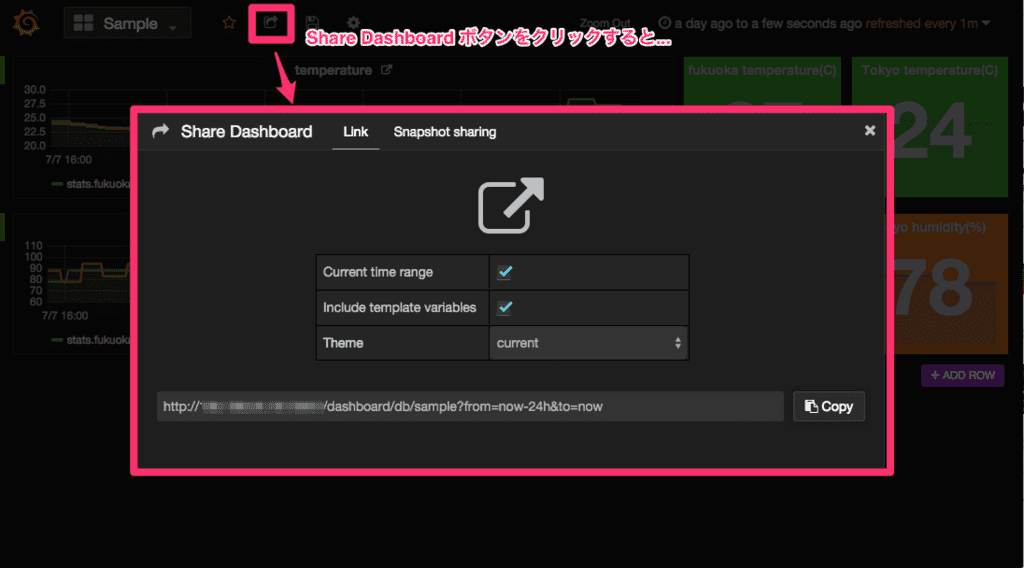
これをこのまま共有するとメトリクスのクエリ情報等の外部に共有する必要の無い情報までも共有されてしまう。
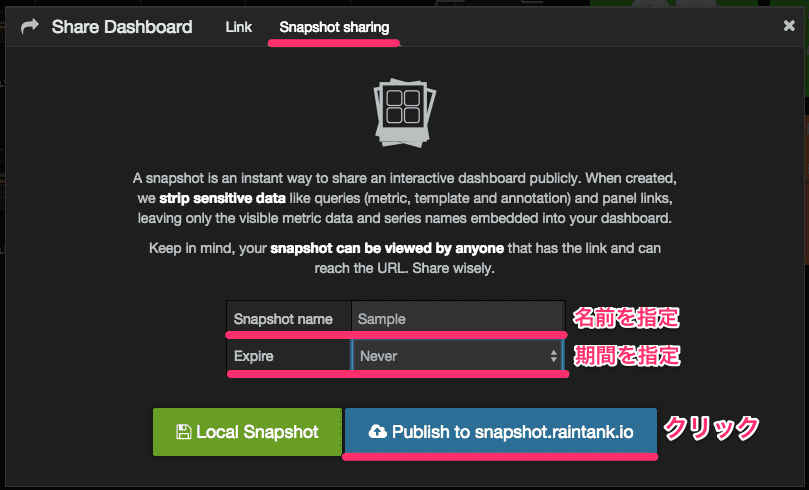
これを解決する為に上記のようなスナップショット機能が提供されており、以下のような 2 つの機能が提供されている。尚、実際に試してみたところ、スナップショット機能はスナップショットを作成した時点よりも以前のメトリクスのみが確認出来るのでまさにスナップショット。
- Publish snapshots(snapshot.raintank.io にパブリッシュする)
- Local snapshot(ローカルの URL が与えられるが Link とは異なる)
今回は Publish snapshots を利用して snapshot.raintank.io に時間限定(1 時間)で公開してみた。
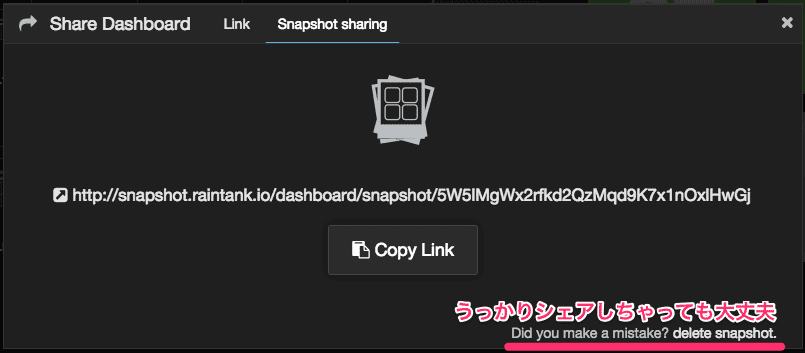
表示されている URL にアクセスしてみると...
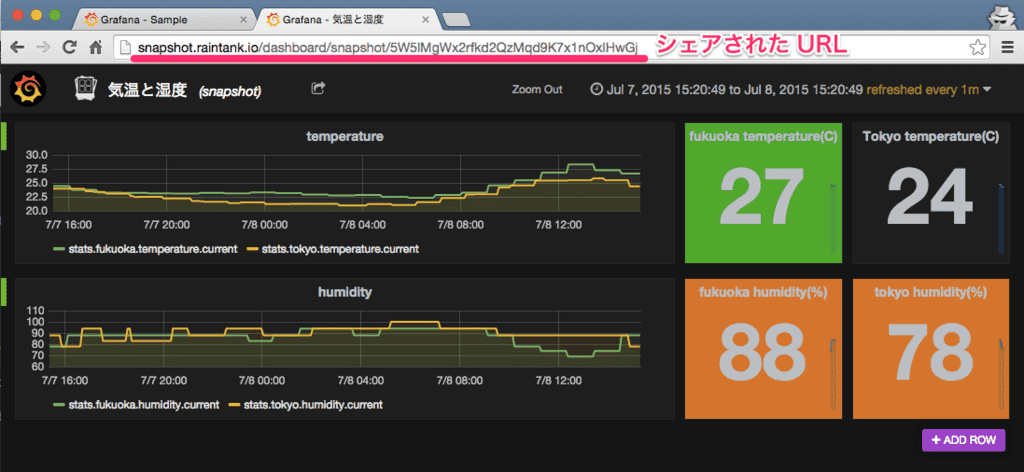
おお。 しかも、日本語のタイトルでも問題無さそう。
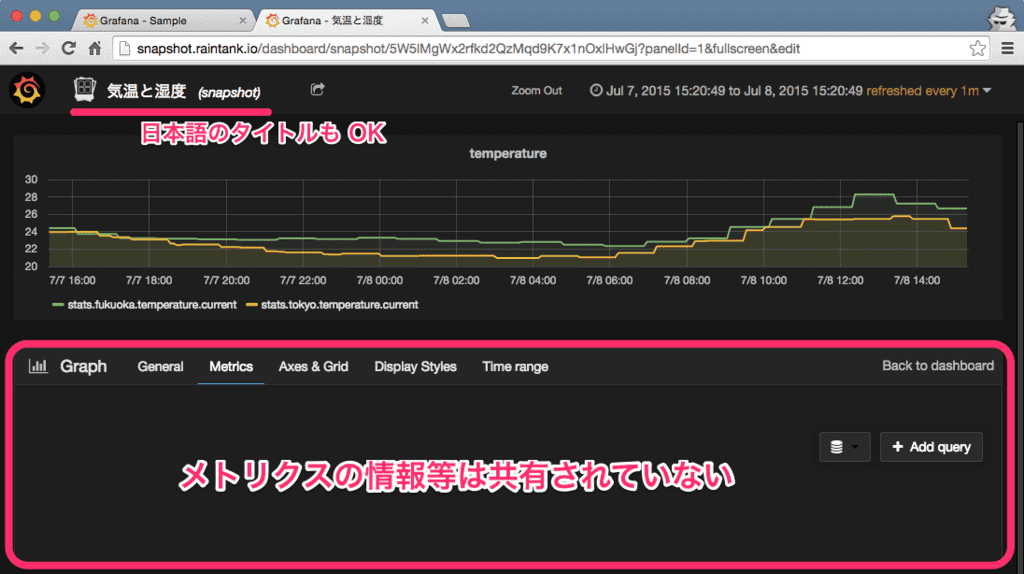
そして、気になるクエリ等が共有されていないかを念のために確認してみるとクエリ等は共有されていない。
ということで...
Grafana 2.0 のインストールからホンのちょっとだけ触ってみたが、データソースの指定や共有機能、今回は触れなかったユーザー管理機能等多くの機能が追加されており、また、以前のバージョンだと閲覧している PC の CPU 負荷が高くなってしまう状況も見られなかったので、従来バージョンを利用している場合にはバージョンアップを検討しても良いかもしれない。
尚、1.x 系から 2.0 へのバージョンアップについては以下のページにて言及されている。
Migrating from v1.x to v2.x - Grafana Documentation
ポイントとしては...
- config.js は廃止
- データソースは Grafana のダッシュボード、HTTP API で再設定する必要がある
- ダッシュボードは Elasticsearch のインデックスを直接参照する方法で移行する
となっている。
次回は...
から...
に変更になったことによる、導入の方法等について復習してみたい。