はじめに
ムシムシとした日が福岡では続いていますがいかがお過ごしでしょうか。
既に奥さんが熱中症っぽい症状で寝込んでしまっているのを見て、旦那として看病以外で役に立てないものか思いを巡らせて辿り着いたのが、気温、湿度を収集して可視化、不快指数を計算して事前に警告する等が手元の環境で出来そうなので試してみたメモ。
OpenWeatherMap で温度と湿度を取得する
OpenWeatherMap とは
OpenWeatherMap current weather and forecast
ざっくり、無料で天気の情報を API 提供してくれる有り難いサイトで、例えば、福岡の天気は以下のようなリクエストを投げる。
$ curl -s 'http://api.openweathermap.org/data/2.5/weather?q=fukuoka-shi,jp&units=metric' | python -m json.tool
以下のようなレスポンスが返ってくる。
{
    "base": "stations",
    "clouds": {
        "all": 75
    },
    "cod": 200,
    "coord": {
        "lat": 33.609999999999999,
        "lon": 130.41999999999999
    },
    "dt": 1436654395,
    "id": 1863967,
    "main": {
        "humidity": 83,
        "pressure": 1004,
        "temp": 26.760000000000002,
        "temp_max": 28.329999999999998,
        "temp_min": 24.440000000000001
    },
    "name": "Fukuoka-shi",
    "sys": {
        "country": "JP",
        "id": 7546,
        "message": 0.0149,
        "sunrise": 1436559409,
        "sunset": 1436610639,
        "type": 1
    },
    "visibility": 10000,
    "weather": [
        {
            "description": "broken clouds",
            "icon": "04n",
            "id": 803,
            "main": "Clouds"
        }
    ],
    "wind": {
        "deg": 110,
        "speed": 1.5
    }
}
レスポンスの詳細については以下のドキュメントを。
ざくっと、今回利用したいキーは以下のとおり。
| JSON キー | 内容 | 備考 |
|---|---|---|
| [‘main’][‘humidity’] | 湿度 | |
| [‘main’][‘temp’] | 温度 | リクエストパラメータで units=metric を付けると摂氏となる |
不快指数とは
気温と湿度から算出する夏の蒸し暑さを数量的に表した指数で計算式は下記の通り。
0.81 × 気温 + 0.01 × 湿度 × (0.99 × 気温 - 14.3) + 46.3
例えば、先ほどの API レスポンスから算出すると以下のとおりとなる。
0.81 × 26.760000000000002 + 0.01 × 83 × (0.99 × 26.760000000000002 - 14.3) + 46.3 = 76.8552
算出された不快指数から体感を以下のように分類されている。(Wikipedia より引用)
| 不快指数 | 体感 |
|---|---|
| ~55 | 寒い |
| 55~60 | 肌寒い |
| 60~65 | 何も感じない |
| 65~70 | 快い |
| 70~75 | 暑くない |
| 75~80 | やや暑い |
| 80~85 | 暑くて汗が出る |
| 85~ | 暑くてたまらない |
ということで、温度、湿度の値を収集しつつ、不快指数を算出してアラートを上げる仕組みを作ってみることにしよう。
Sensu と Grafana の用意
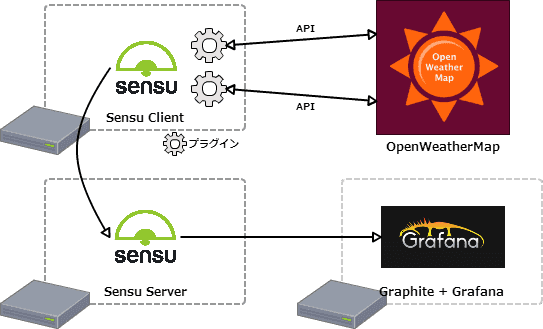
構成

しきい値
しきい値は以下のように定義。
| 不快指数 | 体感 | Sensu のしきい値 |
|---|---|---|
| ~55 | 寒い | Normal(exit 0) |
| 55~60 | 肌寒い | Normal(exit 0) |
| 60~65 | 何も感じない | Normal(exit 0) |
| 65~70 | 快い | Normal(exit 0) |
| 70~75 | 暑くない | Normal(exit 0) |
| 75~80 | やや暑い | Warning(exit 1) |
| 80~85 | 暑くて汗が出る | Warning(exit 1) |
| 85~ | 暑くてたまらない | Critical(exit 2) |
プラグイン
以下のような OpenWeatherMap から取得出来るレスポンスをパースして標準出力に出力するだけのスクリプトを用意。
#!/usr/bin/env python

import json, urllib2, sys, time, random

argvs     = sys.argv
cities    = argvs[1].split(",")
timestamp = int(time.time())


def temperature_humidity_index():
        index = 0.81 * int(temperature) + 0.01 * int(humidity) * (0.99 * int(temperature) - 14.3) + 46.3
        return index

def check():
        index = temperature_humidity_index()
        label = city + ' temperature-humidity_index.current'

        if index >= 85 :
                print '%s %s %s' % (label, index, 'critical')
                sys.exit(2)
        elif index >= 75 :
                print '%s %s %s' % (label, index, 'warning')
                sys.exit(1)
        else:
                print '%s %s %s' % (label, index, 'normal')
                sys.exit(0)

def metrics():
        index = temperature_humidity_index()
        label = 'stats' + '.' + city + '.' + 'temperature.current'
        print '%s %s %dn' % (label, temperature, timestamp)

        label = 'stats' + '.' + city + '.' + 'humidity.current'
        print '%s %s %dn' % (label, humidity, timestamp)

        label = 'stats' + '.' + city + '.' + 'temperature-humidity_index.current'
        print '%s %s %dn' % (label, index, timestamp)

for city in cities:
        url = 'http://api.openweathermap.org/data/2.5/weather?q=' + city + ',jp&units=metric'
        r = urllib2.urlopen(url)
        j = json.loads(r.read())

        temperature = j['main']['temp']
        humidity = j['main']['humidity']

        if argvs[2] == "check":
                check()
        elif argvs[2] == "metrics":
                metrics()

        r.close()
スクリプトはコマンドラインから以下のように実行することで動作確認をすることが出来る。
# チェック
$ ./open_weather_map.py fukuoka-shi check
fukuoka-shi temperature-humidity_index.current 78.1478 warning

# メトリクス
$ ./open_weather_map.py fukuoka-shi,tokyo metrics
stats.fukuoka-shi.temperature.current 29.88 1436683931

stats.fukuoka-shi.humidity.current 58 1436683931

stats.fukuoka-shi.temperature-humidity_index.current 78.1478 1436683931

stats.tokyo.temperature.current 31.76 1436683931

stats.tokyo.humidity.current 70 1436683931

stats.tokyo.temperature-humidity_index.current 82.883 1436683931
メトリクスは第一引数に都市名をカンマ区切りで並べることで複数の都市の温度と湿度を取得出来るようにした。
ということで、メトリクス収集用の Sensu Check の設定。
{
  "checks": {
    "metrics-weather": {
      "type": "metric",
      "handlers": ["graphite", "file"],
      "command": "open_weather_map.py fukuoka-shi,tokyo metrics",
      "interval": 300,
      "standalone": true
    }
  }
}
更に不快指数を判断してアラートを上げる為の Sensu Check 設定。
{
  "checks": {
    "check-temperature-humidity-index-fukuoka": {
      "handlers": ["file"],
      "command": "open_weather_map.py fukuoka-shi check",
      "interval": 300,
      "standalone": true
    }
  }
}
例えば、本日の状況
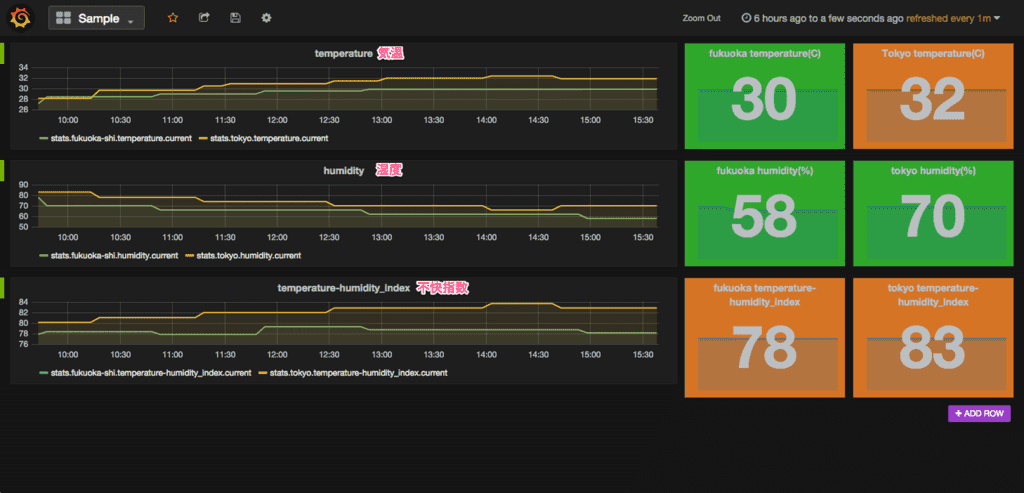
メトリクス

Grafana の Singlestat パネルにもしきい値を設定している。湿度は 60% 前後であるが気温が 30 度を超えており、不快指数は注意レベル。
チェック

Grafana 同様に不快指数は Warning となっている。
ということで…
参考
今回利用した API 以外にも有償の API もあるようだ。
Objective-C – OpenWeatherMap API v2.5から天気を取得する – Qiita
API レスポンスの内容について参考にさせて頂きました。
最後に
OpenWeatherMap に感謝しつつ、気温、湿度、不快指数には注意してコマメな水分補給と休養で熱中症を予防しましょう。


