
おはげようございます。
tl;dr
Datadog でログ監視(ログの中から特定のパターンにマッチしたら何らかのアクションを行う)の方法を模索していて以下の 2 つのパターンを考えたのでメモ。
- Datadog の Agent Check で監視する
- Fluentd を利用する
アプリケーションは Apache を利用し、ステータスコード毎に異なるアクションを行う(正常であれば行わない)シナリオを作って試してみた。
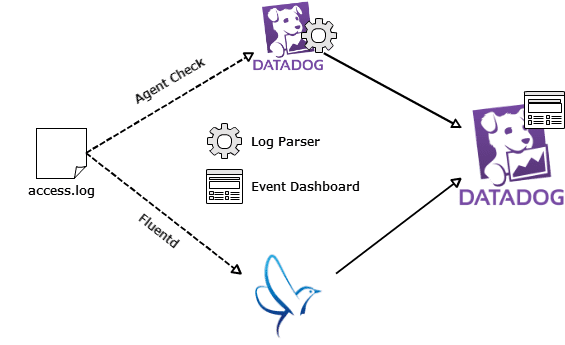
基本的には上図のような構成で、最終的には Datadog Event にポストする際にステータスコードによって event_type を warning と error で振り分ける
Datadog の Agent Check で監視する
参考
Agent Check でログ監視の基本
Datadog の Agent Check でログ監視を行う場合、ログからメトリクス又はイベントを抽出することが出来るが、今回は二つのパターン共にイベントの抽出でやってみる。
尚、Datadog デフォルトのログフォーマットの場合には以下のように datadog.conf に記述するとログ解析が始めることが出来る。
dogstreams: /var/log/web.log
Datadog デフォルトのログフォーマットは半角スペースで区切られたフォーマットで以下のようなフォーマット。
me.web.requests 1320786966 157 metric_type=counter unit=request
me.web.latency 1320786966 250 metric_type=gauge unit=ms
オリジナルログフォーマットの場合
オリジナルのログフォーマットの場合には言わずもがなログパーサーを書く必要がある。Apache のアクセスログもオリジナルのログフォーマットに該当する。今回はイベントの抽出なのでこちらのドキュメントやサンプルを参考に以下のようなパーサーを作ってみた。
from time import strftime
import re
import time

def apache_log_parser(log, line):
    regex = '([(d.)]+) - - [(.*?)] "(.*?)" (d+) (.*?) "(.*?)" "(.*?)"'
    parsed = list(re.match(regex, line).groups())
    # print parsed

    event = {}
    event["aggregation_key"]  = "apache.log-monitor"
    event["timestamp"] = int(time.time())
    event["msg_title"] = "Apache log monitor / Got status code: " + parsed[3]
    event["msg_text"] = "From: " + parsed[0] + " / " + "User-Agent: " + parsed[6]

    if re.match('^5dd$', parsed[3]):
        event["alert_type"] = "error"
        event["event_type"] = "apache.error"
    elif re.match('^4dd$', parsed[3]):
        event["alert_type"] = "warning"
        event["event_type"] = "apache.warning"
    else:
        event["alert_type"] = "info"
        event["event_type"] = "apache.info"

    #print event
    return [event]

#apache_log_parser()
尚、前後するが、実装にあたっては以下のような条件がある。
- Python で書く
- 呼び出し元には Dictionary か配列で返却する必要がある
msg_titleキーは必須
スクリプトを適当はパスに配置した上で datadog.conf に以下のように記載する。
dogstreams: /var/log/apache2/access.log:/path/to/apache-log-parser.py:apache_log_parser
監視したいログのパスの後に : で区切って監視スクリプトのパス、更に : で区切って実際に解析を行うメソッド名を記載する。
あとは datadog-agent を再起動する。
$ sudo service datadog-agent restart
再起動すると /var/log/datadog/collector.log に以下のようなログが記録される。
2015-11-20 07:58:11 JST | INFO | dd.collector | checks.collector(datadog.py:144) | Instantiating function-based dogstream 2015-11-20 07:58:11 JST | INFO | dd.collector | checks.collector(datadog.py:151) | dogstream: parsing /var/log/syslog with(requested /opt/datadog-bin/test.py:syslog_parser) 2015-11-20 07:58:11 JST | INFO | dd.collector | checks.collector(datadog.py:151) | dogstream: parsing /var/log/apache2/access.log with (requested /opt/datadog-bin/apache-log-parser.py:apache_log_parser) 2015-11-20 07:58:11 JST | INFO | dd.collector | checks.collector(datadog.py:48) | Dogstream parsers: [ , ] 2015-11-20 07:58:15 JST | DEBUG | dd.collector | checks.collector(datadog.py:188) | Done dogstream check for file /var/log/syslog 2015-11-20 07:58:15 JST | DEBUG | dd.collector | checks.collector(datadog.py:188) | Done dogstream check for file /var/log/apache2/access.log
適当に Apache にアクセスする。
$ curl localhost > /dev/null
今回はデフォルトでステータスコード 500 を返すように設定しているのでアクセスする度に以下のように Datadog Evnet に登録される。
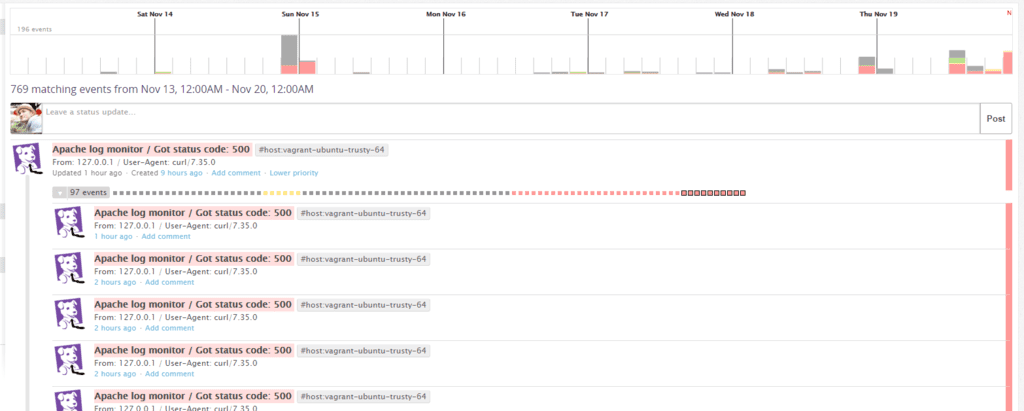
通知(例)
通知に関しては Barkdog を利用して Event Monitor に登録する。
monitor "Apache Status Monitor", :type=>"event alert" do
  query "events('status:error host:vagrant-ubuntu-trusty-64 "status  500"').rollup('count').last('1m') >= 10"
  message "Apache Status Monitor @slack-datadog-notification"
  options do
    no_data_timeframe 2
    notify_audit false
    notify_no_data false
    renotify_interval 0
    silenced({})
    thresholds "critical"=>10
    timeout_h 0
  end
end
Fluentd を利用する
参考
上記は Fluentd で収集した情報を Dogstatd で Datadog に送るパターンだがとても参考になった。
fluent-plugin-rewrite-tag-filter と fluentd-plugin-datadog_event を使う
fluent-plugin-rewrite-tag-filter と拙作の fluentd-plugin-datadog_event を使う。以下のように fluentd.conf を作成する。
  type tail
  path /var/log/apache2/access.log
  format apache2
  pos_file /tmp/apache.access.log.pos
  tag apache.access


  type copy

    type stdout


    type rewrite_tag_filter
    capitalize_regex_backreference yes
    rewriterule2 code ^4dd$     dd.event.warn
    rewriterule3 code ^5dd$     dd.event.error


  type datadog_event
  api_key xxxxxxxxxxxxxxxxxxxxxxxxxxxxxxxxx
  alert_type warning
  aggregation_key fluentd.dd.event


  type datadog_event
  api_key xxxxxxxxxxxxxxxxxxxxxxxxxxxxxxxxx
  alert_type error
  aggregation_key fluentd.dd.event
ステータスコード 400 番台、500 番台を fluent-plugin-rewrite-tag-filter でそれぞれのタグを定義した fluentd-plugin-datadog_event に転送している。
そして、fluentd を起動する。
$ fluentd -c test.conf -l debug.log &
適当に Apache にアクセスする。
$ curl localhost > /dev/null
以下のように Datadog Event に登録される。
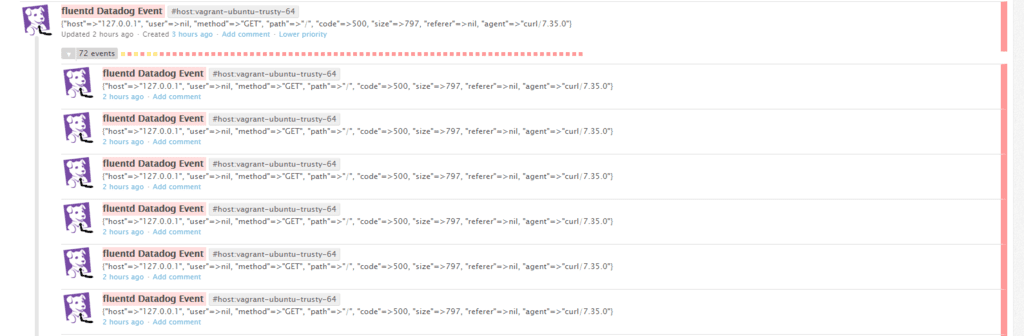
通知(例)
通知に関しては、先ほどと同様に Barkdog を利用して Event Monitor に登録する。
monitor "fluentd Datadog Event", :type=>"event alert" do
  query "events('status:error host:vagrant-ubuntu-trusty-64 "fluentd 500"').rollup('count').last('1m') > 10"
  message "fluentd Datadog Event @slack-datadog-notification"
  options do
    no_data_timeframe 2
    notify_audit false
    notify_no_data false
    renotify_interval 0
    silenced({})
    thresholds "critical"=>10
    timeout_h 0
  end
end
ということで…
どっちがいいのか?
- Agent Check はログパーサーを自分で書けるので用途の応じたロジックでパーサーが書ける
- Fluentd を使えばパーサーを書く必要が無い分手軽、様々なプラグインがあるので Datadog に限らないログ処理が行える
考慮する点
- 自前のログパーサーのメンテなナンス
- Fluentd を運用管理する必要がある
で、どっち?
- 用途次第で使い分けましょう
- どっちとも使うというのもありだと思うが、ホストの負荷等は十分に配慮しましょう