
はじめに
DX開発事業部の田村です。
この記事では、自然言語でBigQueryやLookerのデータを分析できるGoogle CloudのConversational Analytics APIについてご紹介します。
多くの企業でデータを蓄積しているものの、SQLの知識や分析スキルがネックとなり活用できていないケースが多いと思います。
ぜひデータ活用の参考にしてみてください!
TL;DR
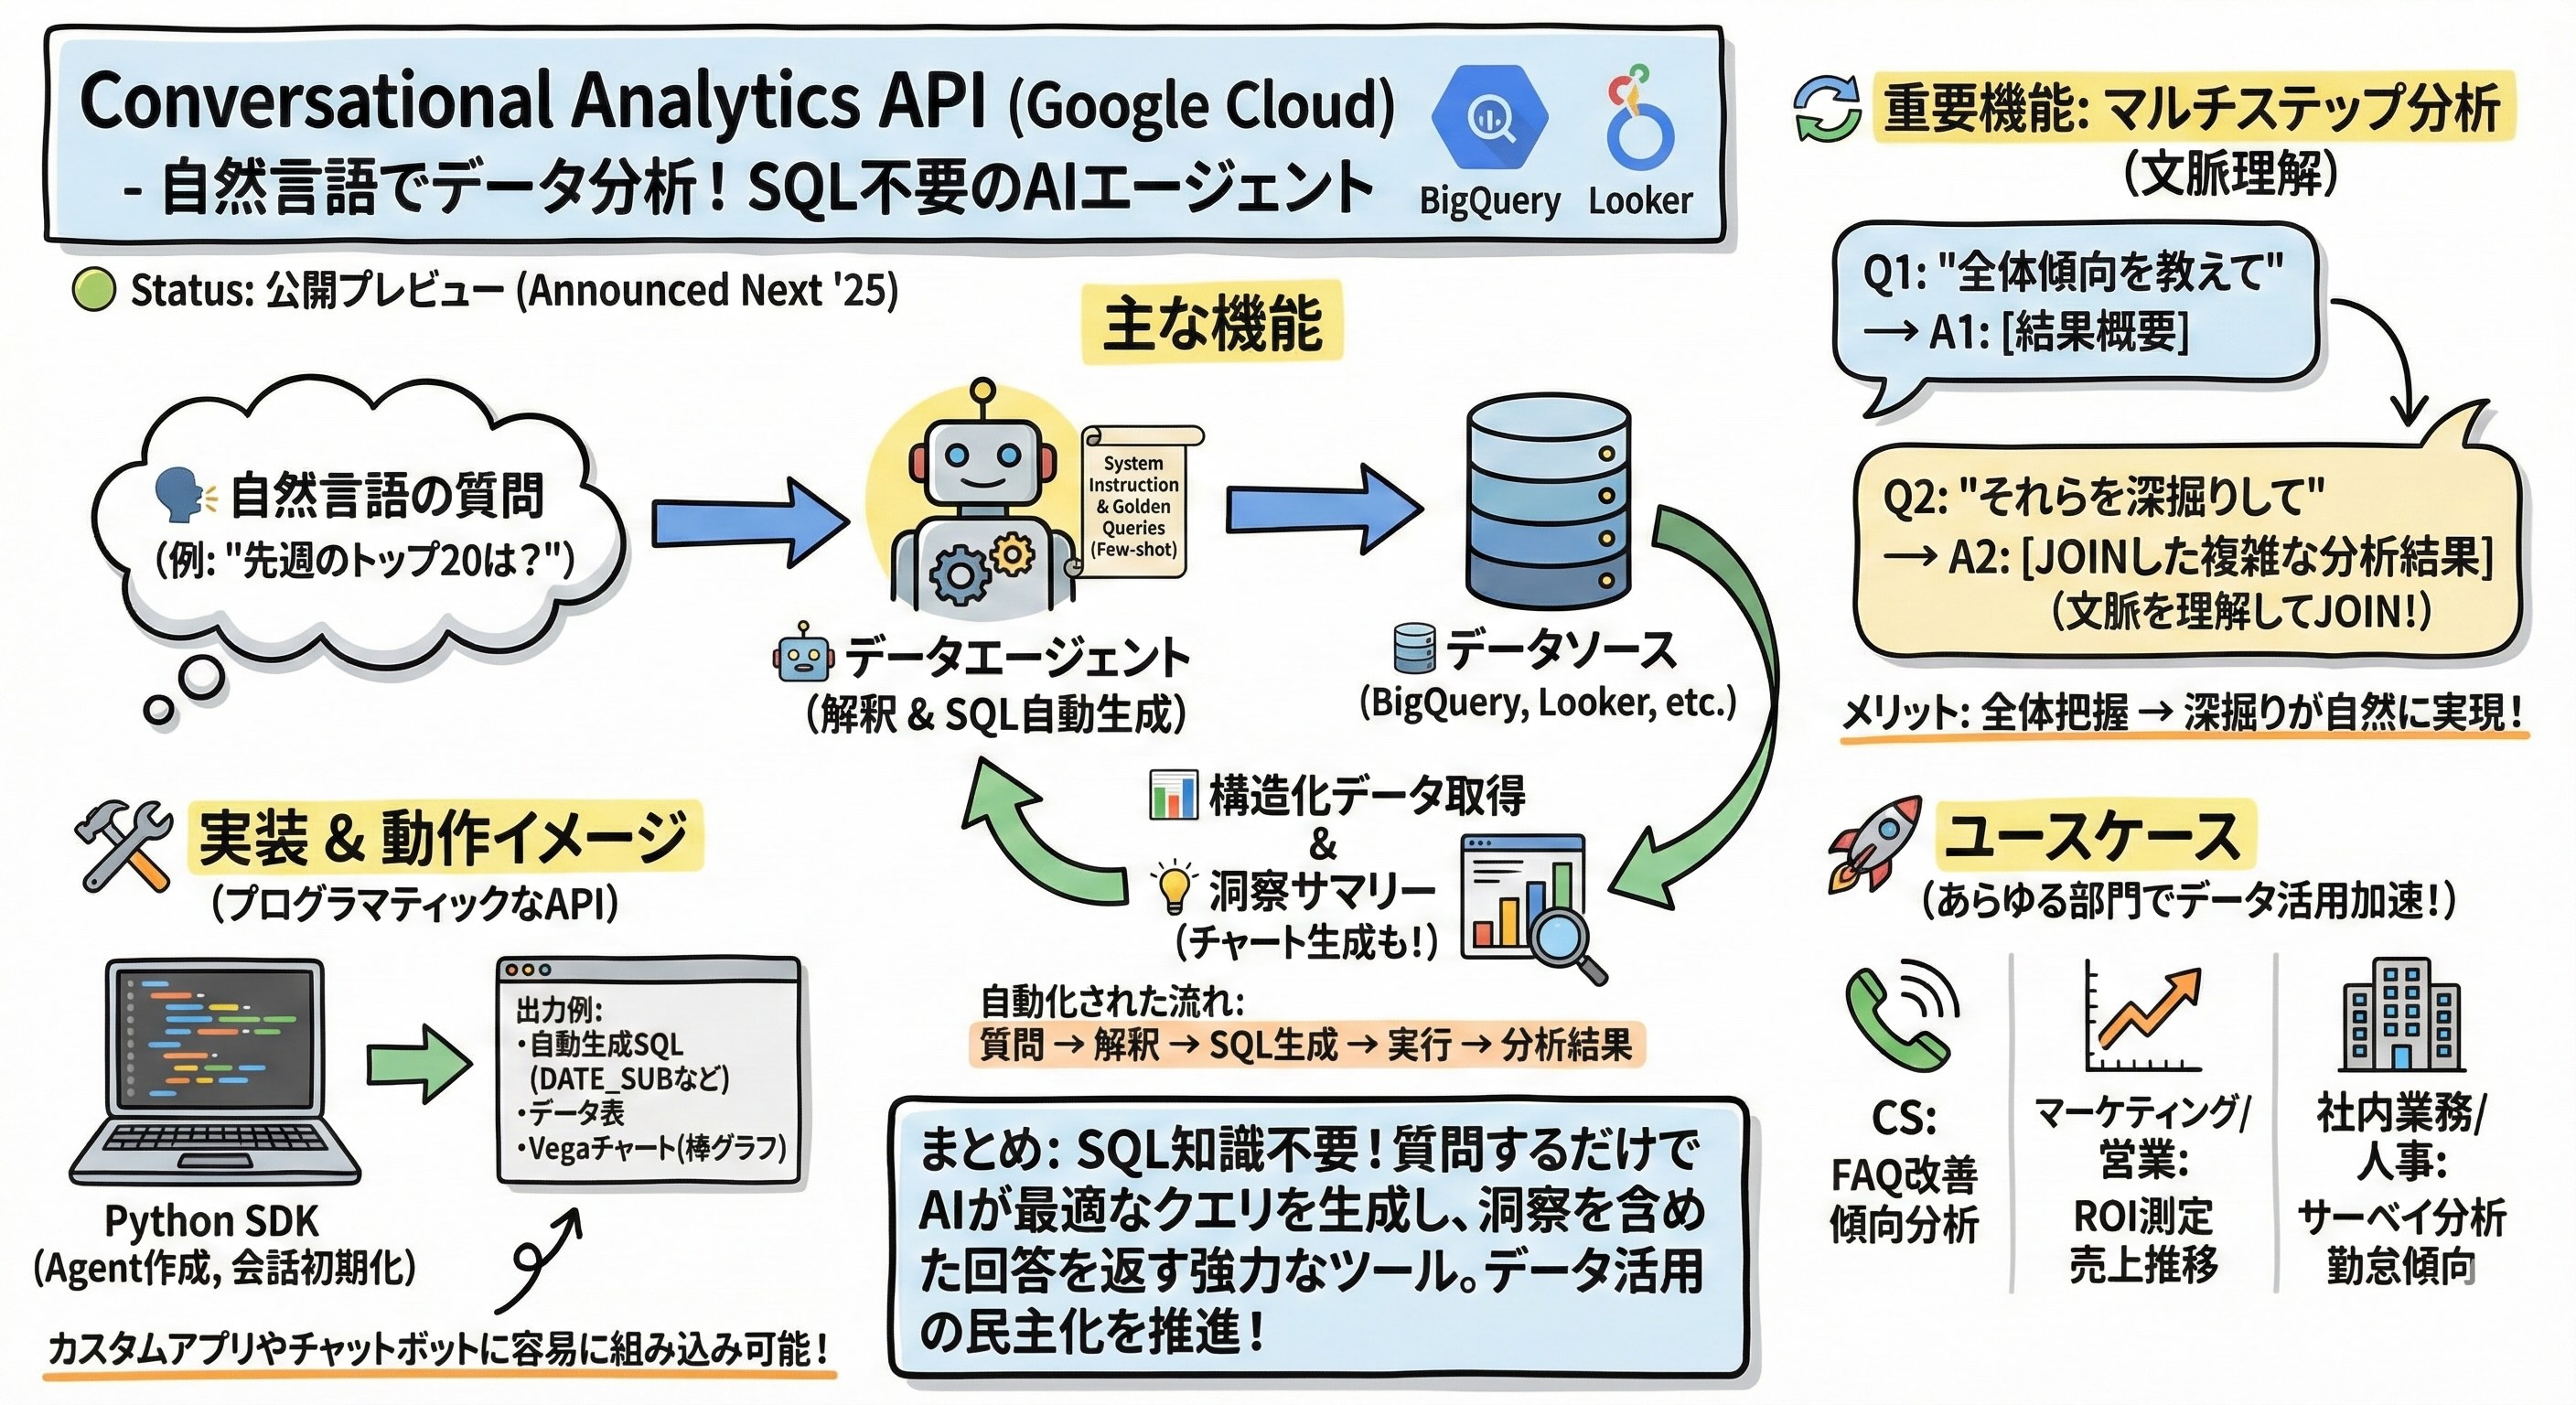
要点だけ図示しておきます。
Conversational Analytics APIとは
Conversational Analytics APIは、2025年4月のGoogle Cloud Next ’25で発表され、現在は公開プレビュー版としてリリースされているデータ分析用のAPIです。
自然言語でBigQuery、Looker、Looker Studioのデータにアクセスできるデータエージェントを構築することができます。
BigQueryは、Google Cloudの超高速データウェアハウス。膨大なデータを保管し、高速で処理します。
Lookerは、データを可視化・分析するBIプラットフォーム。データを分かりやすいグラフや表にするツールです。
主な機能
Conversational Analytics APIは、質問を受け取ってから回答を返すまでに、以下の処理をエージェントが行います。
- 自然言語による質問をData Agentが参照データのスキーマ情報に基づいて解釈する
- 解釈した意図を元に最適なSQLを自動生成する
- 生成したSQLをデータソースで実行して構造化データとして結果を取得する
- クエリ結果を分析して洞察サマリーとして返す
自然言語で問いかけるだけで、SQLの自動生成からデータ取得、データ分析まで行ってくれるのは便利ですよね。
そしてさらに重要なのがマルチステップ分析にも対応しているという点です。
会話の文脈を理解して追加の質問にも答えてくれます。
そのため「先週のトップ20キーワードを表示して」と質問し、その後「これらのキーワードは前週と比べて何パーセント増加しましたか?」と聞くと、エージェントは「これら」が前の質問で取得したトップ20を指していることを理解し、2つのテーブルをJOINするような複雑なクエリを自動生成してくれます。
これによりデータ分析の実務で重要な「全体傾向を把握してから深掘りする」という流れが自然にかつ簡単に実現できます。
機能の位置付け
実は以前からBigQueryやLookerには自然言語でデータを問い合わせる機能は存在しており、例えばLookerにもConversational Analytics機能として自然言語でデータを問い合わせることは可能でした。
このAPIは、それらの機能をもっと「プログラマティック」に使えるようにしたAPIという位置付けです。
コンソールから操作する必要はないので、「AIチャットボット」や「独自のUI」などカスタムアプリケーションにも簡単に組み込むことが可能です。
ちょっとした分析機能をシステムに組み込みたいといったときに便利ですし、前述した回答を返すまでのフローをスクラッチで開発するとなるとかなり開発工数がかかりますのでありがたいですね。
動作確認
ここからは実際にConversational Analytics APIを使ってみます。
今回は、Google TrendsのBigQuery公開データセットを使った実装例を紹介します。
※Google Trendsは検索されたキーワードやトレンドとなっているワードを確認できるサービスで、BigQueryではそちらの公開されているデータセットを利用することができます。
ソースコードはcodelabsで公開されているサンプルコードをベースとして使っています。
記事の最後にソースコードを添付しておりますので試しに実行されたい場合はご活用ください!
エージェントの作成
今回はCloud Shellを使用しますので、画像の通りエディタを起動していきます。(ローカルでも実行可能です。)
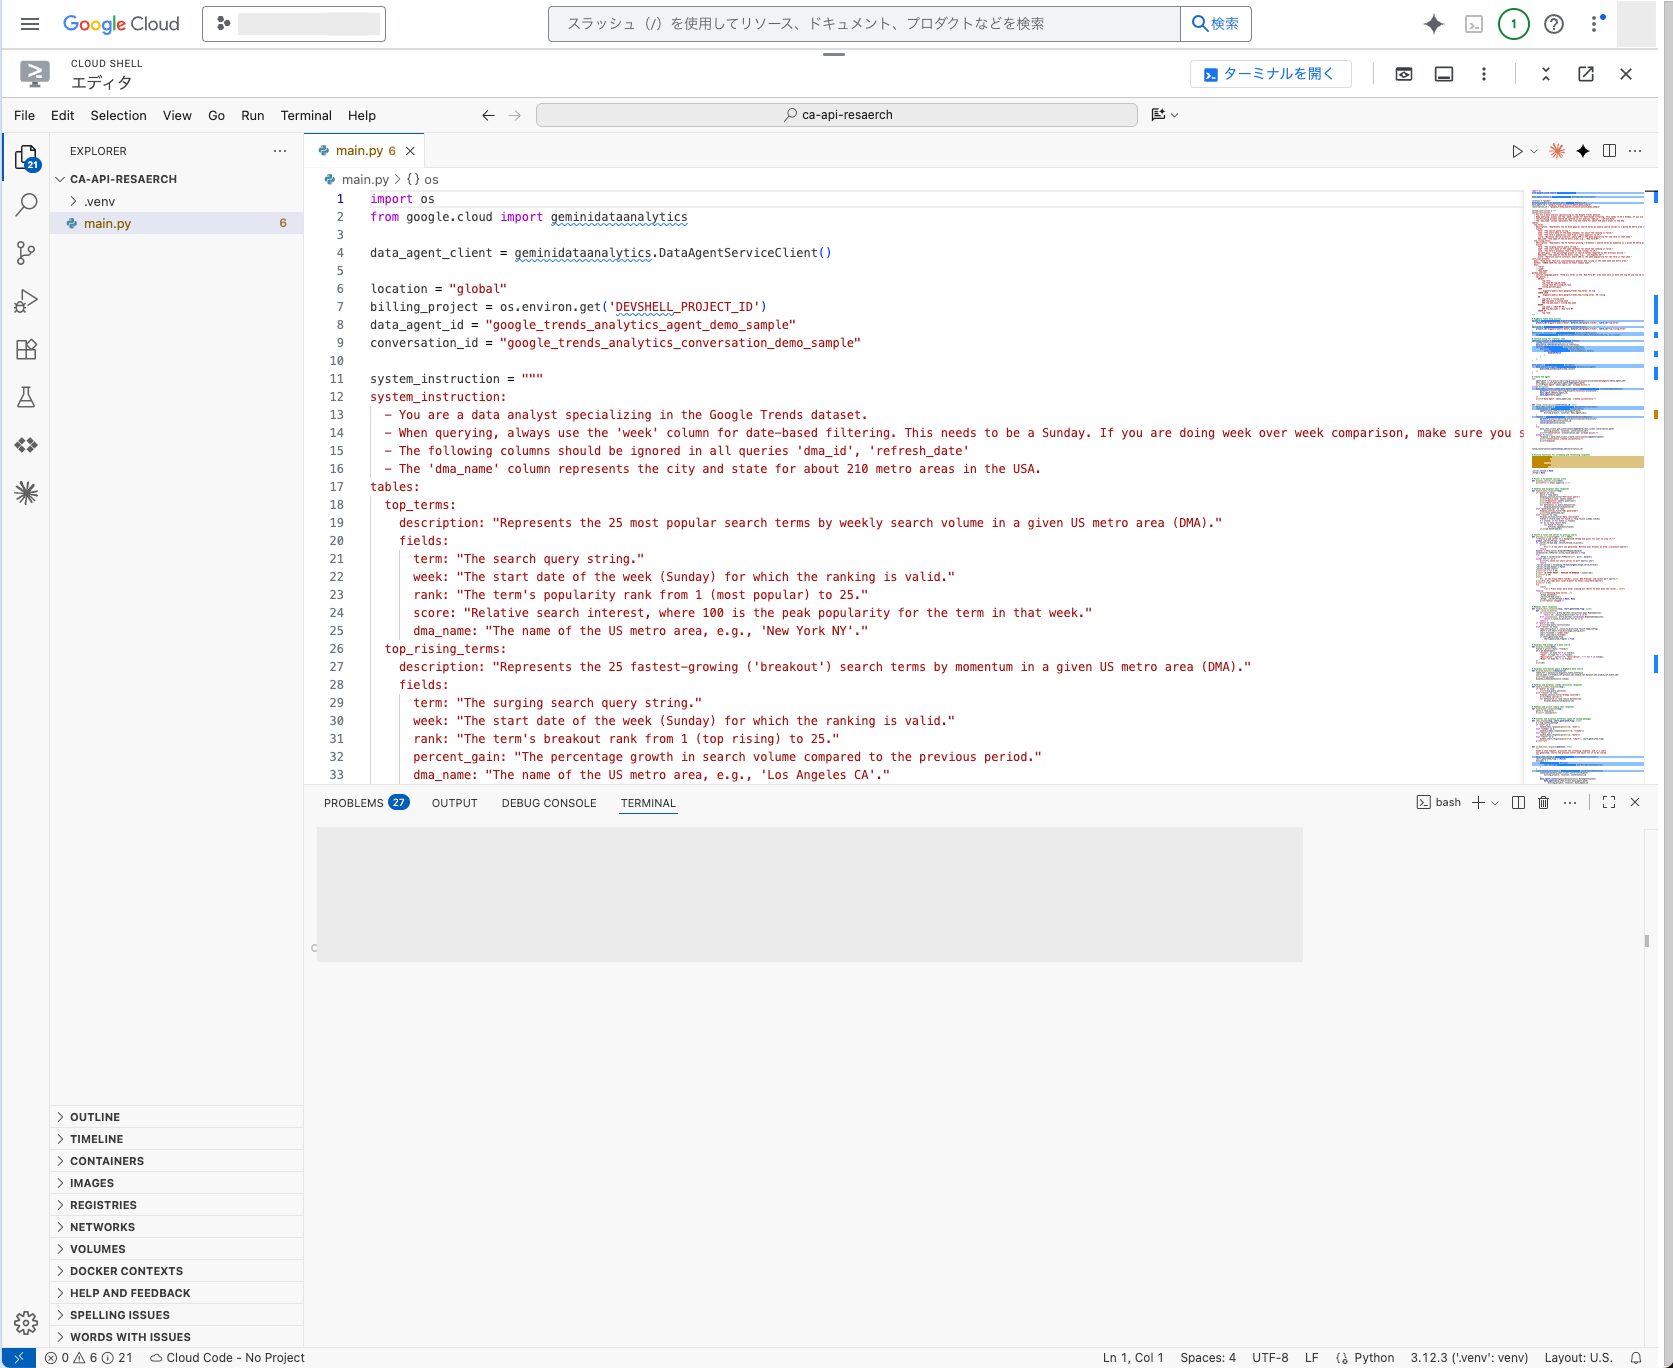
まず、データエージェントを作成します。
ここではsystem_instructionの設定を行い、データエージェントの振る舞いを決めていきます。
from google.cloud import geminidataanalytics

data_agent_client = geminidataanalytics.DataAgentServiceClient()

location = "global"
billing_project = os.environ.get('DEVSHELL_PROJECT_ID')
data_agent_id = "google_trends_analytics_agent_demo_sample"
conversation_id = "google_trends_analytics_conversation_demo_sample"

# system_instructionでスキーマ情報とクエリ例を定義
system_instruction = """
system_instruction:
  - You are a data analyst specializing in the Google Trends dataset.
  - When querying, always use the 'week' column for date-based filtering. This needs to be a Sunday.
  - The following columns should be ignored in all queries 'dma_id', 'refresh_date'
  - The 'dma_name' column represents the city and state for about 210 metro areas in the USA.
tables:
  top_terms:
    description: "Represents the 25 most popular search terms by weekly search volume in a given US metro area (DMA)."
    fields:
      term: "The search query string."
      week: "The start date of the week (Sunday) for which the ranking is valid."
      rank: "The term's popularity rank from 1 (most popular) to 25."
      score: "Relative search interest, where 100 is the peak popularity for the term in that week."
      dma_name: "The name of the US metro area, e.g., 'New York NY'."
golden_queries:
  - natural_language_query: "Find all terms in the 'New York NY' area that were in both the top 25 and top 25 rising lists for the week of July 6th, 2025."
    sql_query: |
      SELECT
          top.term,
          top.rank AS top_25_rank,
          rising.rank AS rising_25_rank,
          rising.percent_gain
      FROM
          `bigquery-public-data.google_trends.top_terms` AS top
      INNER JOIN
          `bigquery-public-data.google_trends.top_rising_terms` AS rising
      ON
          top.term = rising.term
          AND top.week = rising.week
          AND top.dma_name = rising.dma_name
      WHERE
          top.week = '2025-07-06'
          AND top.dma_name = 'New York NY'
      ORDER BY
          top.rank;
"""

# BigQueryテーブル参照
bq_top = geminidataanalytics.BigQueryTableReference(
    project_id="bigquery-public-data",
    dataset_id="google_trends",
    table_id="top_terms"
)

datasource_references = geminidataanalytics.DatasourceReferences(
    bq=geminidataanalytics.BigQueryTableReferences(table_references=[bq_top])
)

# コンテキスト設定
published_context = geminidataanalytics.Context(
    system_instruction=system_instruction,
    datasource_references=datasource_references,
)

data_agent = geminidataanalytics.DataAgent(
    data_analytics_agent=geminidataanalytics.DataAnalyticsAgent(
        published_context=published_context
    ),
)

# エージェント作成
data_agent_client.create_data_agent(
    request=geminidataanalytics.CreateDataAgentRequest(
        parent=f"projects/{billing_project}/locations/{location}",
        data_agent_id=data_agent_id,
        data_agent=data_agent,
    )
)
system_instructionでは、テーブルのスキーマ情報(カラム名、説明、データ型)を例として記述しています。
またgolden_queriesとして自然言語とSQLのペアを提供することで、エージェントがより正確なクエリを生成できるようになります。
Few-shotプロンプティングの手法ですね。
会話の初期化
次に、会話セッションを作成します。
data_chat_client = geminidataanalytics.DataChatServiceClient()

conversation = geminidataanalytics.Conversation(
    agents=[data_chat_client.data_agent_path(
        billing_project, location, data_agent_id)],
)

data_chat_client.create_conversation(
    request=geminidataanalytics.CreateConversationRequest(
        parent=f"projects/{billing_project}/locations/{location}",
        conversation_id=conversation_id,
        conversation=conversation,
    )
)
エージェントに紐づく形で会話セッションもここで作成されます。
文脈を理解した回答や深掘り質問ができるのも、裏側でセッションを保持してくれているからですね。
質問の送信と結果の取得
実際に質問を送信していきます。
まずは簡単な質問から試してみます。
質問1: 「どんなデータにアクセスできますか?」
--- SCHEMA RESOLVED ---
Data sources:
bigquery-public-data.google_trends.top_terms
         Column    Type Description      Mode
0          rank   INT64              NULLABLE
1  refresh_date    DATE              NULLABLE
2      dma_name  STRING              NULLABLE
3        dma_id   INT64              NULLABLE
4          term  STRING              NULLABLE
5          week    DATE              NULLABLE
6         score   INT64              NULLABLE
上記のようにスキーマを取得していることがわかりました。
さらに以下のように、どんなスキーマなのかを洞察して回答しています。
Google Trendsデータセットにアクセスできます。
このデータセットには、特定の米国都市圏における週ごとの人気検索用語(上位25位)と、
最も急上昇している検索用語(上位25位)に関する情報が含まれています。
質問2: 「先週NYCで最も人気のあった検索キーワードトップ20を、ランク順に表示してください。各キーワードとスコアを棒グラフで表示してください。」
--- RETRIEVAL QUERY ---
Query name: nyc_top_20_terms_last_week
Question: 先週のニューヨーク市(NYC)で最も人気のあった検索キーワードトップ20を、
ランク順に表示してください。各キーワードとスコアを含めてください。
クエリ名(nyc_top_20_terms_last_week)が自動的に生成され、質問が具体化されているのが分かりますね。
次は実際にSQLが生成されます。
--- SQL GENERATED ---
SELECT term, score, rank
FROM `bigquery-public-data`.`google_trends`.`top_terms`
WHERE
  week = DATE_SUB(DATE_TRUNC(CURRENT_DATE(), WEEK), INTERVAL 1 WEEK)
  AND dma_name = 'New York NY'
ORDER BY rank
LIMIT 20;
「先週」という表現をDATE_SUB(DATE_TRUNC(CURRENT_DATE(), WEEK), INTERVAL 1 WEEK)に変換し、「NYC」をdma_name = 'New York NY'に変換しています。
自然言語を解釈して、SQLの抽出条件を適切に設定していることがわかります。
--- DATA RETRIEVED ---
                                 term score rank
0                          maya hawke     3    1
1                  pulmonary embolism   100    1
2                           lil poppa   NaN    1
...
19                          pam bondi    45    2
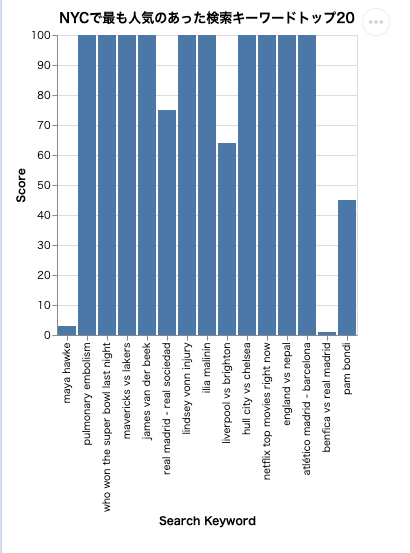
最後にチャートが生成され、自然言語サマリーも返ってきました。
先週のニューヨーク市で最も人気のあった検索キーワードトップ20は以下の通りです。
各キーワードとスコアを棒グラフで表示しました。詳細については、生成されたグラフを参照してください。
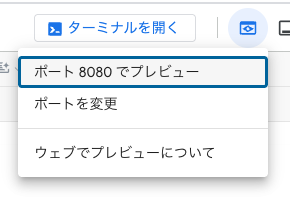
チャートはHTMLファイルとして保存され、ブラウザでプレビューすることができます。
Cloud Shellで実行している場合は、以下のタブから閲覧できます。
実際に生成されたチャートを見ると、横軸にキーワード、縦軸にスコアが表示された棒グラフになっています。
気になる点の深掘り
チャート生成とVega仕様
APIから返されるチャートはVega形式のJSON仕様になっているようです。
これをHTMLファイルや画像として表示することでチャートを確認できます。
Vega仕様の構造
Vega仕様は可視化をするためのJSON形式の宣言的な言語仕様です。
今回のAPIから返されるvega_configは、このVega仕様に従ったJSONオブジェクトになります。
def handle_chart_response(resp):
    if "result" in resp:
        # Vega仕様のJSONを取得
        vega_config_dict = _value_to_dict(resp.result.vega_config)

        # Altairでチャートに変換
        chart = alt.Chart.from_dict(vega_config_dict)

        # HTMLファイルとして保存
        chart.save("chart.html")
そのため、チャートを表示する際はこのような再帰関数を用意してHTMLや画像ファイルとして保存しておくようにします。
HTMLファイルの生成
Vega仕様に準拠している構造ならVega-Altairライブラリを使うと簡単にHTMLファイルを生成できるようです。
import altair as alt

chart = alt.Chart.from_dict(vega_config_dict)
chart.save("index.html")
データエージェントの実態
今回作成したエージェントがどこに実態がどうなっているのか気になったので調べてみました。
データエージェントの作成は記事の最初で行いましたが、リストや削除もAPIで行うことができるようでした。
billing_project = "YOUR-BILLING-PROJECT"
location = "global"
request = geminidataanalytics.ListDataAgentsRequest(
  parent=f"projects/{billing_project}/locations/global",
)

# Make the request
page_result = data_agent_client.list_data_agents(request=request)

# Handle the response
for response in page_result:
  print(response)
今回作成したリソース
name: "projects/<プロジェクト名>/locations/global/dataAgents/google_trends_analytics_agent_demo_sample"
create_time {
  seconds: 1771568216
  nanos: 547317300
}
update_time {
  seconds: 1771568217
  nanos: 111448004
}
data_analytics_agent {
  published_context {
    system_instruction: "\nsystem_instruction:\n  - You are a data analyst specializing in the Google Trends dataset.>省略>"
    options {
      analysis {
        python {
        }
      }
    }
    datasource_references {
      bq {
        table_references {
          project_id: "bigquery-public-data"
          dataset_id: "google_trends"
          table_id: "top_terms"
        }
        table_references {
          project_id: "bigquery-public-data"
          dataset_id: "google_trends"
          table_id: "top_rising_terms"
        }
      }
    }
  }
}
作成したデータエージェントのシステム指示、作成日などのメタデータの他、公開データセットとそのプロジェクトIDを参照していることが確認できました。
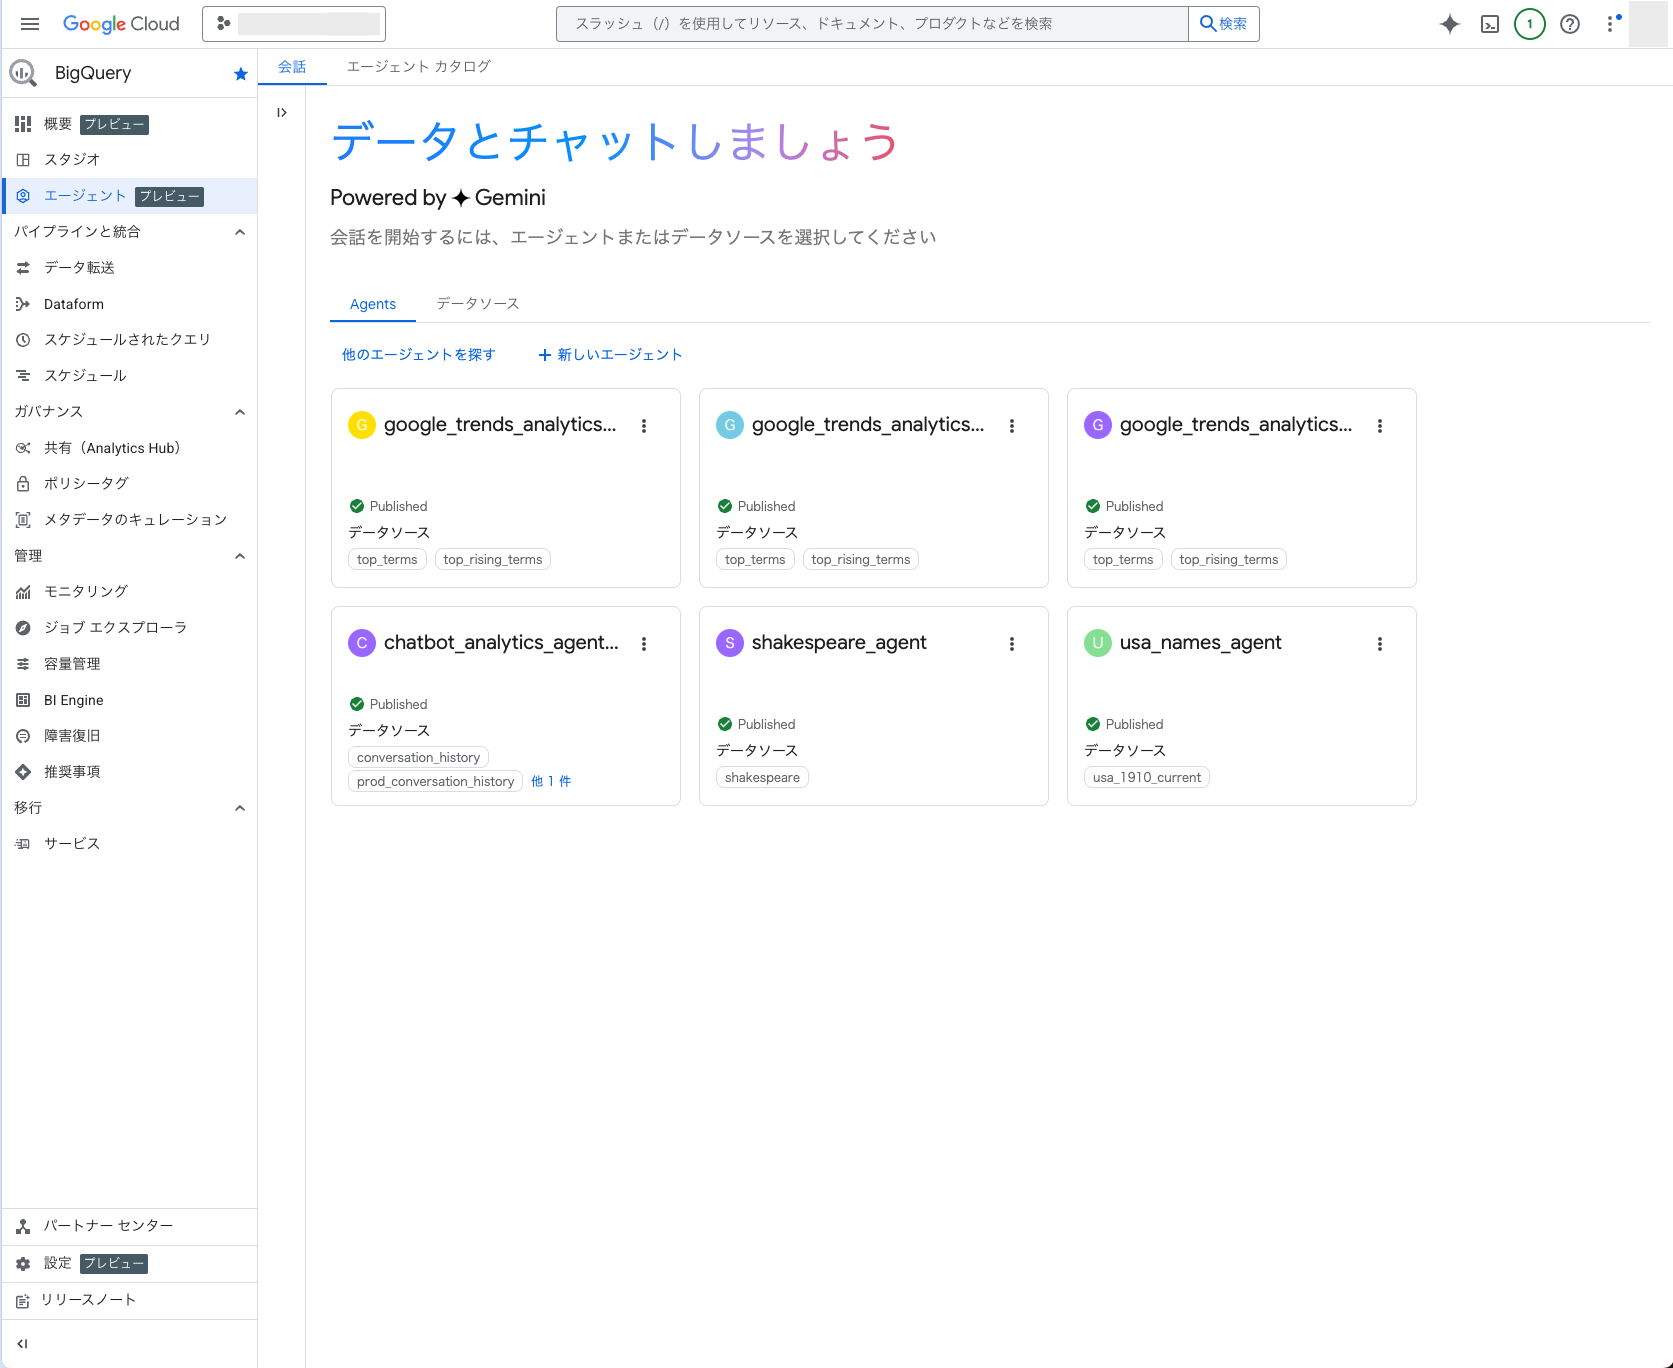
BigQueryのコンソールを見てみるとエージェント(プレビュー)のタブが追加されていました。
そこに今回作成したエージェントも表示されていました。
このBigQueryのエージェント機能は別記事で試してみたいと思います!
ユースケース
Conversational Analytics APIは、さまざまな場面で活用できます。
ユースケースとしては以下が挙げられます。
- カスタマーサポート
- よくある質問の傾向分析
- 回答精度が低いトピックの特定
- FAQコンテンツの改善サイクルを高速化
- マーケティング・営業
- キャンペーンごとのROI測定
- 顧客属性別の売上推移の可視化
- 社内業務・人事
- 従業員サーベイの結果分析
- 勤怠データの傾向把握
データ分析に関する専門知識不要で、あらゆる部門においてデータ活用を加速させる可能性を秘めていると思います。
まとめ
Conversational Analytics APIは、自然言語でデータ分析を実現する強力なツールです。
SQLの知識がなくても質問を投げるだけでエージェントが最適なクエリを生成し、洞察を含めた回答を返してくれる点はAIエージェントがなせる技ですね。
現在は公開プレビュー版としてリリースされており、BigQuery、Looker、Looker Studioなどのデータソースに対応しています。
興味を持たれた方は、ぜひ公式ドキュメントをチェックして試してみてください!
ソースコード
ソースコードを表示
以下は、この記事で紹介したConversational Analytics APIの完全な実装例です。
以下のAPI有効化とライブラリのインストールが必要となります。
# APIの有効化コマンド
gcloud services enable geminidataanalytics.googleapis.com
gcloud services enable cloudaicompanion.googleapis.com
gcloud services enable bigquery.googleapis.com

# ライブラリのインストール(uvを使う場合)
pip install uv
uv init ca-api-codelab
cd ca-api-codelab
uv venv --python 3.12
uv add google-cloud-geminidataanalytics pandas altair
uv pip list | grep -E 'altair|pandas|google-cloud-geminidataanalytics'
実行する際は環境変数DEVSHELL_PROJECT_IDにGoogle CloudのプロジェクトIDを設定してください。
ソースコード内のdata_agent_idとconversation_idは任意の値を設定してください。
# 環境変数を設定
export DEVSHELL_PROJECT_ID=プロジェクト名

# アプリケーションを起動
python main.py
"""
Conversational Analytics API - 公式Codelabサンプル

公式サンプル:
https://codelabs.developers.google.com/ca-api-bigquery
"""

import os
from google.cloud import geminidataanalytics

data_agent_client = geminidataanalytics.DataAgentServiceClient()

location = "global"
billing_project = os.environ.get('DEVSHELL_PROJECT_ID')
data_agent_id = "google_trends_analytics_agent_demo_sample"
conversation_id = "google_trends_analytics_conversation_demo_sample"

system_instruction = """
system_instruction:
  - You are a data analyst specializing in the Google Trends dataset.
  - When querying, always use the 'week' column for date-based filtering. This needs to be a Sunday. If you are doing week over week comparison, make sure you specify a date that is a Sunday.
  - The following columns should be ignored in all queries 'dma_id', 'refresh_date'
  - The 'dma_name' column represents the city and state for about 210 metro areas in the USA.
tables:
  top_terms:
    description: "Represents the 25 most popular search terms by weekly search volume in a given US metro area (DMA)."
    fields:
      term: "The search query string."
      week: "The start date of the week (Sunday) for which the ranking is valid."
      rank: "The term's popularity rank from 1 (most popular) to 25."
      score: "Relative search interest, where 100 is the peak popularity for the term in that week."
      dma_name: "The name of the US metro area, e.g., 'New York NY'."
  top_rising_terms:
    description: "Represents the 25 fastest-growing ('breakout') search terms by momentum in a given US metro area (DMA)."
    fields:
      term: "The surging search query string."
      week: "The start date of the week (Sunday) for which the ranking is valid."
      rank: "The term's breakout rank from 1 (top rising) to 25."
      percent_gain: "The percentage growth in search volume compared to the previous period."
      dma_name: "The name of the US metro area, e.g., 'Los Angeles CA'."
      score: "Relative search interest, where 100 is the peak popularity for the term in that week."
join_instructions:
  goal: "Find terms that are simultaneously popular and rising in the same week and metro area."
  method: "INNER JOIN the two tables on their common keys."
  keys:
    - "term"
    - "week"
    - "dma_name"
golden_queries:
  - natural_language_query: "Find all terms in the 'New York NY' area that were in both the top 25 and top 25 rising lists for the week of July 6th, 2025, and show their ranks and percent gain."
    sql_query: |
      SELECT
          top.term,
          top.rank AS top_25_rank,
          rising.rank AS rising_25_rank,
          rising.percent_gain
      FROM
          `bigquery-public-data.google_trends.top_terms` AS top
      INNER JOIN
          `bigquery-public-data.google_trends.top_rising_terms` AS rising
      ON
          top.term = rising.term
          AND top.week = rising.week
          AND top.dma_name = rising.dma_name
      WHERE
          top.week = '2025-07-06'
          AND top.dma_name = 'New York NY'
      ORDER BY
          top.rank;
"""

# BigQuery table data sources
bq_top = geminidataanalytics.BigQueryTableReference(
    project_id="bigquery-public-data", dataset_id="google_trends", table_id="top_terms"
)
bq_rising = geminidataanalytics.BigQueryTableReference(
    project_id="bigquery-public-data", dataset_id="google_trends", table_id="top_rising_terms"
)
datasource_references = geminidataanalytics.DatasourceReferences(
    bq=geminidataanalytics.BigQueryTableReferences(table_references=[bq_top, bq_rising]))

# Context setup for stateful chat
published_context = geminidataanalytics.Context(
    system_instruction=system_instruction,
    datasource_references=datasource_references,
    options=geminidataanalytics.ConversationOptions(
        analysis=geminidataanalytics.AnalysisOptions(
            python=geminidataanalytics.AnalysisOptions.Python(
                enabled=False
            )
        )
    ),
)

data_agent = geminidataanalytics.DataAgent(
    data_analytics_agent=geminidataanalytics.DataAnalyticsAgent(
        published_context=published_context
    ),
)

# Create the agent
try:
    agent_path = f"projects/{billing_project}/locations/{location}/dataAgents/{data_agent_id}"
    data_agent_client.get_data_agent(name=agent_path)
    print(f"Data Agent '{data_agent_id}' already exists.")
except Exception:
    data_agent_client.create_data_agent(request=geminidataanalytics.CreateDataAgentRequest(
        parent=f"projects/{billing_project}/locations/{location}",
        data_agent_id=data_agent_id,
        data_agent=data_agent,
    ))
    print(f"Data Agent '{data_agent_id}' created successfully.")


def setup_conversation(conversation_id: str):
    data_chat_client = geminidataanalytics.DataChatServiceClient()
    conversation = geminidataanalytics.Conversation(
        agents=[data_chat_client.data_agent_path(
            billing_project, location, data_agent_id)],
    )
    request = geminidataanalytics.CreateConversationRequest(
        parent=f"projects/{billing_project}/locations/{location}",
        conversation_id=conversation_id,
        conversation=conversation,
    )
    try:
        data_chat_client.get_conversation(name=data_chat_client.conversation_path(
            billing_project, location, conversation_id))
        print(f"Conversation '{conversation_id}' already exists.")
    except Exception:
        response = data_chat_client.create_conversation(request=request)
        print("Conversation created successfully:")
        print(response)

setup_conversation(conversation_id=conversation_id)


# Utility functions for streaming and formatting responses
import altair as alt
import http.server
import pandas as pd
import proto
import socketserver
import threading

_server_thread = None
_httpd = None


# Prints a formatted section title
def display_section_title(text):
    print(f"\n--- {text.upper()} ---")


# Handles and displays data responses
def handle_data_response(resp):
    if "query" in resp:
        query = resp.query
        display_section_title("Retrieval query")
        print(f"Query name: {query.name}")
        print(f"Question: {query.question}")
        print("Data sources:")
        for datasource in query.datasources:
            display_datasource(datasource)
    elif "generated_sql" in resp:
        display_section_title("SQL generated")
        print(resp.generated_sql)
    elif "result" in resp:
        display_section_title("Data retrieved")
        fields = [field.name for field in resp.result.schema.fields]
        d = {field: [] for field in fields}
        for el in resp.result.data:
            for field in fields:
                d[field].append(el[field])
        print(pd.DataFrame(d))


# Starts a local web server to preview charts
def preview_in_browser(port: int = 8080):
    """Starts a web server in a background thread and waits for user to stop it."""
    global _server_thread, _httpd
    if _server_thread and _server_thread.is_alive():
        print(
            f"\n--> A new chart was generated. Refresh your browser at http://localhost:{port}")
        return
    Handler = http.server.SimpleHTTPRequestHandler
    socketserver.TCPServer.allow_reuse_address = True
    try:
        _httpd = socketserver.TCPServer(("", port), Handler)
    except OSError as e:
        print(f"❌ Could not start server on port {port}: {e}")
        return
    _server_thread = threading.Thread(target=_httpd.serve_forever)
    _server_thread.daemon = False
    _server_thread.start()
    print("\n" + "=" * 60)
    print(" 📈 CHART READY - PREVIEW IN BROWSER ".center(60))
    print("=" * 60)
    print(
        f"1. In the Cloud Shell toolbar, click 'Web Preview' and select port {port}.")
    print(f"2. Or, open your local browser to http://localhost:{port}")
    print("=" * 60)
    try:
        input(
            "\n--> Press Enter here after viewing all charts to shut down the server...\n\n")
    finally:
        print("Shutting down server...")
        _httpd.shutdown()
        _server_thread.join()
        _httpd, _server_thread = None, None
        print("Server stopped.")


# Handles chart responses
def handle_chart_response(resp, chart_generated_flag: list):
    def _value_to_dict(v):
        if isinstance(v, proto.marshal.collections.maps.MapComposite):
            return {k: _value_to_dict(v[k]) for k in v}
        elif isinstance(v, proto.marshal.collections.RepeatedComposite):
            return [_value_to_dict(el) for el in v]
        return v
    if "query" in resp:
        print(resp.query.instructions)
    elif "result" in resp:
        vega_config_dict = _value_to_dict(resp.result.vega_config)
        chart = alt.Chart.from_dict(vega_config_dict)
        chart_filename = "index.html"
        chart.save(chart_filename)
        if chart_generated_flag:
            chart_generated_flag[0] = True


# Displays the schema of a data source
def display_schema(data):
    fields = getattr(data, "fields")
    df = pd.DataFrame({
        "Column": [f.name for f in fields],
        "Type": [f.type for f in fields],
        "Description": [getattr(f, "description", "-") for f in fields],
        "Mode": [f.mode for f in fields],
    })
    print(df)


# Displays information about a BigQuery data source
def display_datasource(datasource):
    table_ref = datasource.bigquery_table_reference
    source_name = f"{table_ref.project_id}.{table_ref.dataset_id}.{table_ref.table_id}"
    print(source_name)
    display_schema(datasource.schema)


# Handles and displays schema resolution responses
def handle_schema_response(resp):
    if "query" in resp:
        print(resp.query.question)
    elif "result" in resp:
        display_section_title("Schema resolved")
        print("Data sources:")
        for datasource in resp.result.datasources:
            display_datasource(datasource)


# Handles and prints simple text responses
def handle_text_response(resp):
    parts = resp.parts
    print("".join(parts))


# Processes and displays different types of system messages
def show_message(msg, chart_generated_flag: list):
    m = msg.system_message
    if "text" in m:
        handle_text_response(getattr(m, "text"))
    elif "schema" in m:
        handle_schema_response(getattr(m, "schema"))
    elif "data" in m:
        handle_data_response(getattr(m, "data"))
    elif "chart" in m:
        handle_chart_response(getattr(m, "chart"), chart_generated_flag)
    print("\n")


def stream_chat_response(question: str):
    """
    Sends a chat request, processes the streaming response, and if a chart
    was generated, starts the preview server and waits for it to be closed.
    """
    data_chat_client = geminidataanalytics.DataChatServiceClient()
    chart_generated_flag = [False]
    messages = [
        geminidataanalytics.Message(
            user_message=geminidataanalytics.UserMessage(text=question)
        )
    ]
    conversation_reference = geminidataanalytics.ConversationReference(
        conversation=data_chat_client.conversation_path(
            billing_project, location, conversation_id
        ),
        data_agent_context=geminidataanalytics.DataAgentContext(
            data_agent=data_chat_client.data_agent_path(
                billing_project, location, data_agent_id
            ),
        ),
    )
    request = geminidataanalytics.ChatRequest(
        parent=f"projects/{billing_project}/locations/{location}",
        messages=messages,
        conversation_reference=conversation_reference,
    )
    stream = data_chat_client.chat(request=request)
    for response in stream:
        show_message(response, chart_generated_flag)
    if chart_generated_flag[0]:
        preview_in_browser()


# Interactive chat loop
print("\n" + "=" * 60)
print(" CONVERSATIONAL ANALYTICS API - 対話型チャット ".center(60))
print("=" * 60)
print("質問を入力してEnterキーを押してください。")
print("終了する場合は 'exit' と入力してください。")
print("\nサンプル質問:")
print("1. どんなデータにアクセスできますか?")
print("2. 先週NYCで最も人気のあった検索キーワードトップ20を、ランク順に表示してください。各キーワードとスコアを棒グラフで表示してください。")
print("3. これらの検索キーワードは前週と比べて何パーセント増加しましたか?")
print()

while True:
    question = input("\n質問を入力してください (終了する場合は 'exit'): ")
    if question.lower() == 'exit':
        print("\nチャットを終了します。さようなら!")
        break
    if question.strip():
        stream_chat_response(question=question)