
以前こちらの記事「dstat(fluent-plugin-dstat)の情報をCloudWatchに登録してみた」を紹介しました。
今回はそのアップデートになります。
尚、上述の方法によりAmazon CloudWatch Monitoring Scripts for Linuxの形に近付けた感じになります。
まずはdstatからになります。
参考としてこちらの記事「Dstatでディスク使用量を確認する」を紹介しておきます。
今回利用するオプションは下記とします。
# dstat --load --swap --mem --freespace
---load-avg--- ----swap--- ------memory-usage----- -----/-----
 1m   5m  15m | used  free| used  buff  cach  free| used  free
   0    0    0|   0  1024M| 119M  120M  306M 45.1M|3053M 2994M
...
これにより、load average、swap使用量、memory使用量、disk使用量を確認することが可能になります。
次にfluent-plugin-dstatですが、設定ファイルに下記のように上記オプションを指定します。
# cat /etc/td-agent/td-agent.conf

    type   dstat
    tag    dstat
    option --load --swap --mem --freespace
    delay  300


    type copy

        type file
        path /tmp/dstat
(delayオプションで)5分(300秒)毎に出力されるようにしており、ログは下記の通りとなります。
# cat /tmp/dstat.20130402.b4d94e2fc68c46642
2013-04-02T00:22:19+09:00       dstat   {"hostname":"ip-10-0-0-76","dstat":{"load avg":{"1m":"0.030","5m":"0.010","15m":"0.0"},"swap":{"used":"0.0","free":"1073733632.0"},"memory usage":{"used":"126222336.0","buff":"125665280.0","cach":"324575232.0","free":"42729472.0"},"/":{"used":"3202244608.0","free":"3139084288.0"}}}
2013-04-02T00:23:19+09:00       dstat   {"hostname":"ip-10-0-0-76","dstat":{"load avg":{"1m":"0.010","5m":"0.0","15m":"0.0"},"swap":{"used":"0.0","free":"1073733632.0"},"memory usage":{"used":"126791680.0","buff":"125677568.0","cach":"324628480.0","free":"42094592.0"},"/":{"used":"3202232320.0","free":"3139096576.0"}}}
...
さらにCloudWatchへのPutです。
以前、「FluentdのCloudWatchプラグイン(fluent-plugin-cloudwatch_ya)をRubyGems.orgに公開してみた」の
記事で作成したプラグインの利用しています。
実際の設定ファイルは下記の通りです。
type dstat
tag dstat
option --load --swap --mem --freespace
delay 300
type copy
type file
path /tmp/dstat
type cloudwatch_ya
buffer_type file
buffer_path /opt/suz-lab/var/lib/td-agent/buf/cloudwatch.dstat
flush_interval 5m
cloud_watch_endpoint monitoring.ap-northeast-1.amazonaws.com
namespace SUZ-LAB/CentOS
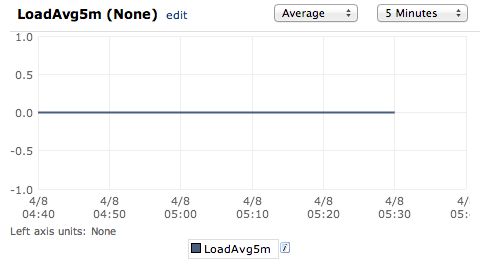
metric_name LoadAvg5m
value_key $['dstat']['load avg']['5m']
unit None
outcast_no_dimension_metric yes
instance_id yes
metric_name SwapUsed
value_key $['dstat']['swap']['used']
unit Bytes
outcast_no_dimension_metric yes
instance_id yes
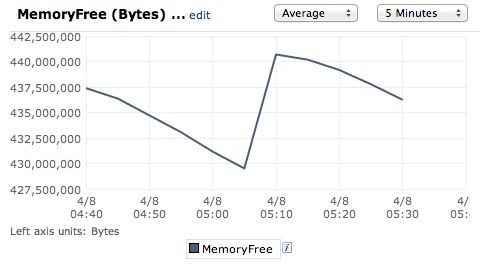
metric_name MemoryFree
value_key $['dstat']['memory usage']['free']
unit Bytes
outcast_no_dimension_metric yes
instance_id yes
metric_name DiskRootFree
value_key $['dstat']['/']['free']
unit Bytes
outcast_no_dimension_metric yes
instance_id yes
こちらも5分毎(flush_interval 5m)にCloudWatchにPutするようにしています。
下記のようにカスタムメトリックスが登録されていることをAWSマネジメントコンソールで確認できます。


さらに、こちらのNagiosプラグイン「NagiosのCloudWatchプラグイン(Python版AWSコマンドラインツール版)」で
監視することも可能です。