
- 2/17 追記
— 正式リリース - Datadog APM
— ベータ版
— Datadog APM とは
— 用語(ドキュメントの Terminology より引用させて頂きます)
—– Trace
—– Span
—– Service
—– Resource - 試してみるばい
— 今回 Rubyで試すくさ
— Datadog Agentの導入
— 今回のアプリケーションは…
—– ddtrace をインストール
—– app.rb にちょっと追記
—– アプリケーションを起動
— Trace 開始 - 最後に
2/17 追記
正式リリース
www.datadoghq.com
これからちゃんと使っていくぞ!
Datadog APM
ベータ版
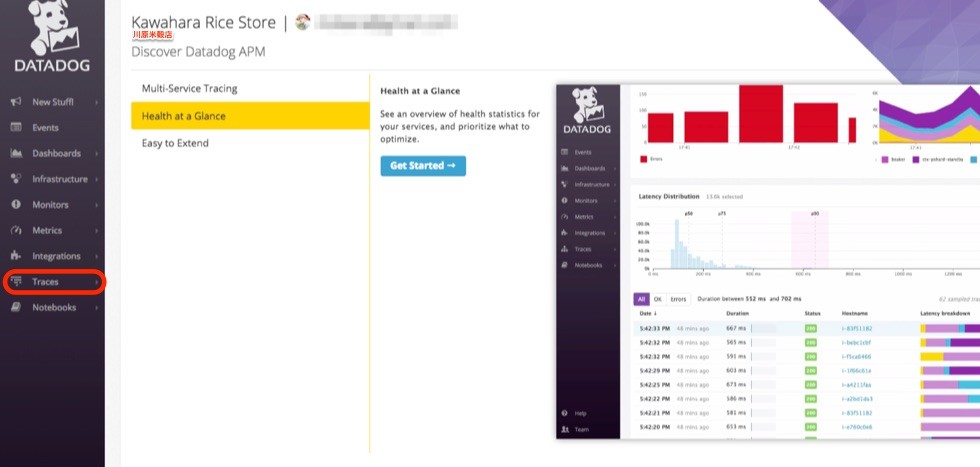
ベータ利用の募集をしていたので申し込んだことを忘れていて、久しぶりにダッシュボードをみたら Trace というメニューが増えていたので、「こやつが APM か!」ということで、Get Started に掲載されている手順をなぞってみたメモ。
尚、本記事はベータ版にて試した情報となるので、正式リリースされた際には画面の状態や実装等が異なること場合があるので注意されたし、されたし。
Datadog APM とは
www.datadoghq.com
自分のざっくりとした理解としては…
- NewRelic のようにアプリケーションのパフォーマンス(スループットやレイテンシ等)のメトリクスも収集することが出来る
- まずは Python と Ruby そして Go からサポートを開始
- 従来から Datadog が得意としていたインフラ周りのメトリクスと組み合わせることでトラブルシューティングがやりやすくなる
- APM 自体のデプロイは簡単
- 従来からの Datadog の機能はそのまま利用することが出来る
ということで、インフラのメトリクスは Datadog でモニタリングしつつ、アプリケーションのパフォーマンスは別のツールでモニタリングしているような状況があれば、Datadog 一つに統合することで、開発エンジニアと運用管理エンジニアは一つのダッシュボードでサービスのクオリティ向上の話しが出来るようになる…と思っている。
用語(ドキュメントの Terminology より引用させて頂きます)
Trace
Used to track the time spent by an application processing a single operation. For example, a trace can be used to track the entire time spent processing a complicated web request. Even though the request may require multiple resources and machines to handle the request, all of these function calls and sub-requests would be encapsulated within a single trace.
単一の操作を処理するアプリケーションが費やした時間を追跡するために使用されます。たとえば、複雑なWeb要求を処理するために費やされる時間全体を追跡するためにトレースを使用できます。要求が複数のリソースとマシンで要求を処理する必要がある場合でも、これらの関数呼び出しとサブ要求はすべて単一のトレース内にカプセル化されます。(Powered by Google 翻訳)
Span
Represents a logical unit of work in the system. Each trace consists of one or more spans. Spans are associated with a service and optionally a resource. Each span consists of a start time, a duration, and optional tags. For example, a span can describe the time spent on a distributed call on a separate machine, or the time spent in a small component within a larger operation. Spans can be nested within each other, and in those instances will have a parent-child relationship.
システム内の論理作業単位を表します。各トレースは、1つまたは複数のスパンから構成されます。スパンはサービスおよびオプションでリソースに関連付けられます。各スパンは、開始時間、継続時間、およびオプションのタグで構成されます。たとえば、あるスパンでは、別のマシンで分散呼び出しに費やされた時間、または大きな操作の中の小さなコンポーネントで費やされた時間を表すことができます。スパンは相互にネストすることができ、それらのインスタンスには親子関係があります。(Powered by Google 翻訳)
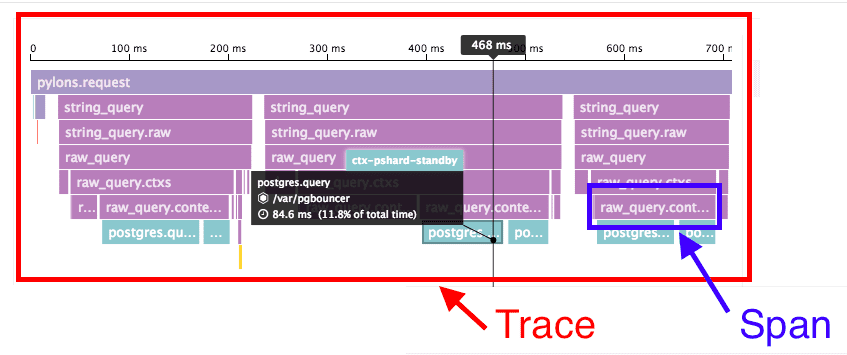
以下は Trace と Span の関係を表した図。(ドキュメントの Terminology より拝借。)
Service
The name of a set of processes that do the same job. For instance, a simple web application may consist of two services: a single webapp service and a single database service, while a more complex environment may break it out into 6 services: 3 separate webapp, admin, and query services, along with a master-db, a replica-db, and a yelp-api external service.
同じジョブを実行する一連のプロセスの名前。たとえば、単純なWebアプリケーションは、1つのWebアプリケーションサービスと1つのデータベースサービスの2つのサービスで構成されますが、より複雑な環境では3つの ‘webapp’、’admin’、 ‘master-db’、 ‘replica-db’、 ‘yelp-api’の外部サービスを提供しています。(Powered by Google 翻訳)
Resource
A particular query to a service. For a web application, some examples might be a canonical URL like /user/home or a handler function like web.user.home (often referred to as “routes” in MVC frameworks). For a sql database, a resource would be the sql of the query itself like select * from users where id = ?.
サービスへの特定のクエリ。 Webアプリケーションの場合、/ user / homeのような標準的なURLや、web.user.homeのようなハンドラ関数(MVCフレームワークでは “ルート”と呼ばれることが多い)の例があります。 SQLデータベースの場合、リソースは ‘select * from users where id =?’のようなクエリ自体のSQLになります。(Powered by Google 翻訳)
試してみるばい
今回は Ruby で試すくさ
現在、Python と Ruby と Go で APM を利用することが出来るようだが、今回は以下のドキュメントを参考にしつつ Ruby(Sinatra)で簡単なアプリケーションをこさえて、どんな感じで Datadog のダッシュボードで見ることが出来るのかを試してみることにする。
Datadog Agent の導入
APM を利用する為には、まず、Datadog Agent の最新版を導入しておく必要がある。
# 試す環境(だいぶん古い)
$ cat /etc/lsb-release
DISTRIB_ID=Ubuntu
DISTRIB_RELEASE=14.04
DISTRIB_CODENAME=trusty
DISTRIB_DESCRIPTION="Ubuntu 14.04.2 LTS"

# Datadog Agent の導入
$ DD_API_KEY=xxxxxxxxxxxxxxxxxxxxxxxxxxx bash -c "$(curl -L https://raw.githubusercontent.com/DataDog/dd-agent/master/packaging/datadog-agent/source/install_agent.sh)"
/etc/datadog.conf を以下のように修正する。
$ sudo diff -u datadog.conf.original datadog.conf
--- datadog.conf.original       2017-02-11 17:27:47.678033363 +0900
+++ datadog.conf        2017-02-11 17:29:35.482033755 +0900
@@ -1,5 +1,7 @@
 [Main]

+apm_enabled: true
+
 # check_freq: 60

 # The host of the Datadog intake server to send Agent data to
@@ -223,3 +225,11 @@
 log_to_syslog: no
 # syslog_host:
 # syslog_port:
+
+[trace.sampler]
+extra_sample_rate=1
+max_traces_per_second=10
+
+[trace.receiver]
+receiver_port=17777
+connection_limit=2000
試した環境の都合上、trace.receiver の receiver_port を 17777 に設定しているが、後ほど導入する trace agent ではデフォルトは 7777 番ポートに収集した情報をポストするようになっている。(trace agent 側で設定を変更することが出来る)
設定が終わったら、Datadog Agent は再起動しておく。
sudo service datadog-agent restart
今回のアプリケーションは…
github.com
この雑なアプリケーションを利用する。
ddtrace をインストール
早速、以下のように Gemfile に ddtrace を追加してインストールする。
source 'https://rubygems.org'

gem 'sinatra'
gem 'sinatra-reloader'
gem 'ddtrace'
この ddtrace がアプリケーションの各種メトリクスを収集することになる。
app.rb にちょっと追記
以下のように app.rb に追記。
require 'sinatra'
require 'sinatra/reloader'
require 'ddtrace'                         # ここ追記
require 'ddtrace/contrib/sinatra/tracer'  # ここ追記

# ここ追記
configure do
  settings.datadog_tracer.configure default_service: 'oreno-application',
                                    debug: true,
                                    trace_agent_hostname: '127.0.0.1',
                                    trace_agent_port: 17777
end

enable :sessions

USERS = [
  { 'username': 'foo', 'password': 'foo01' },
  { 'username': 'bar', 'password': 'bar01' },
  { 'username': 'baz', 'password': 'baz01' },
]

get '/' do
  s = Random.rand  # ここはちょっとウェイト入れたかったのでおまけ
  puts s           # ここはちょっとウェイト入れたかったのでおまけ
  erb :index
end

post '/login' do
  s = Random.rand
  puts s
  sleep(s)
  user = USERS.select {|u| u[:username] == params[:username] && u[:password] == params[:password]}[0]
  if user != nil
    session[:username] = params[:username]
    redirect to('/main')
  else
    erb :error
  end
end

get '/main' do
  s = Random.rand
  puts s
  @username = session[:username]
  erb :main
end

get '/logout' do
  s = Random.rand
  puts s
  redirect to('/')
end
configure ブロックでは以下の設定を記述することが出来る。(http://gems.datadoghq.com/trace/docs/ より抜粋)
enabled: define if the tracer is enabled or not. If set to false, the code is still instrumented but no spans are sent to the local trace agent.default_service: set the service name used when tracing application requests. Defaults to sinatratracer: set the tracer to use. Usually you don’t need to change that value unless you’re already using a different initialized tracer somewhere elsedebug: set to true to enable debug logging.trace_agent_hostname: set the hostname of the trace agent.trace_agent_port: set the port the trace agent is listening on.
Trace において、service 名(上記の default_service で定義する値)が Datadog 上でアプリケーションを識別する為のキーのような役割となっているようだ。
アプリケーションを起動
試した環境の都合でポートは 3000 番で起動させた。
bundle exec ruby app.rb -o 0.0.0.0 -p 3000
アプリケーションを起動させたら、以下のようなスクリプトでガンガン虐めてみる。
Trace 開始
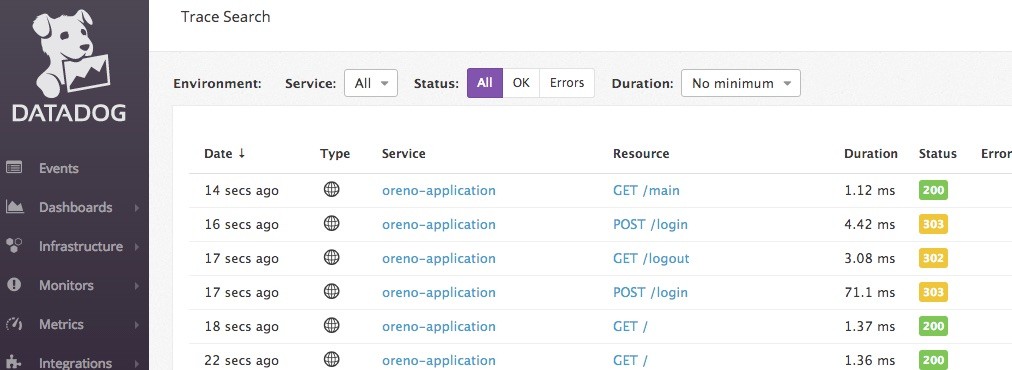
ということで、正常に Datadog にメトリクスの情報が送信されると Trace > Trace Search から下図のように確認することが出来るようになる。
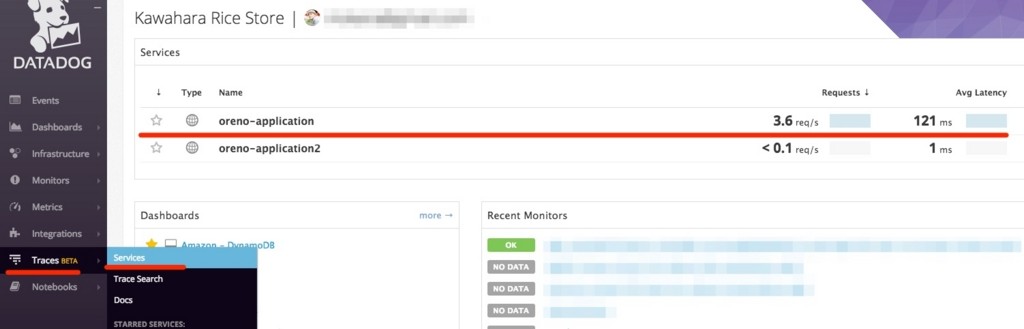
また、Trace > Services からは下図のようにサービスの一覧に app.rb 内の default_service で定義したoreno-application を確認することが出来る。
暫くアプリケーションにアクセスを掛けておくと以下のように、アプリケーション全体のレイテンシの分布や毎秒のリクエスト数等が記録される。
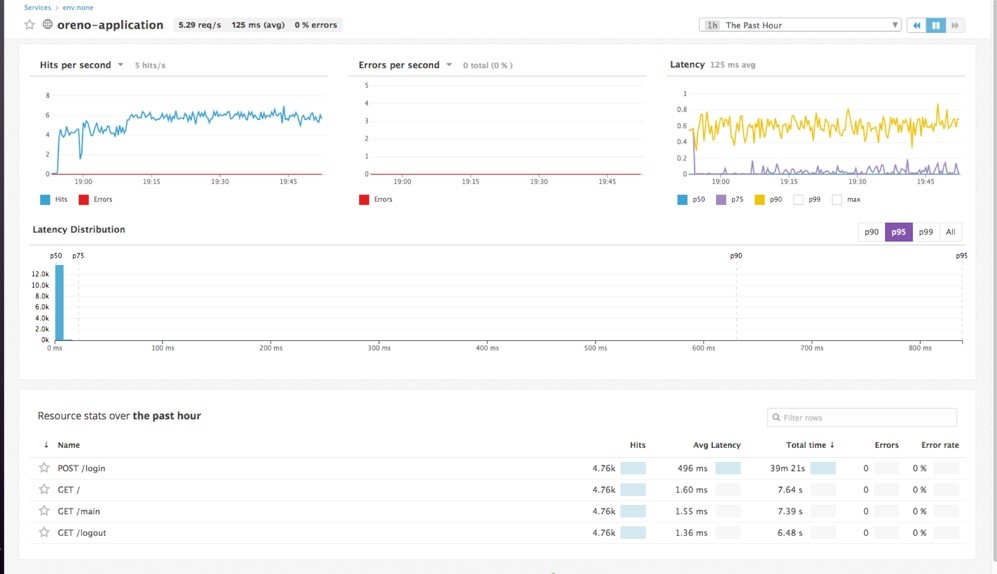
更に、リソース毎(今回の例だと各 URL のパス)の情報も確認することが出来る。
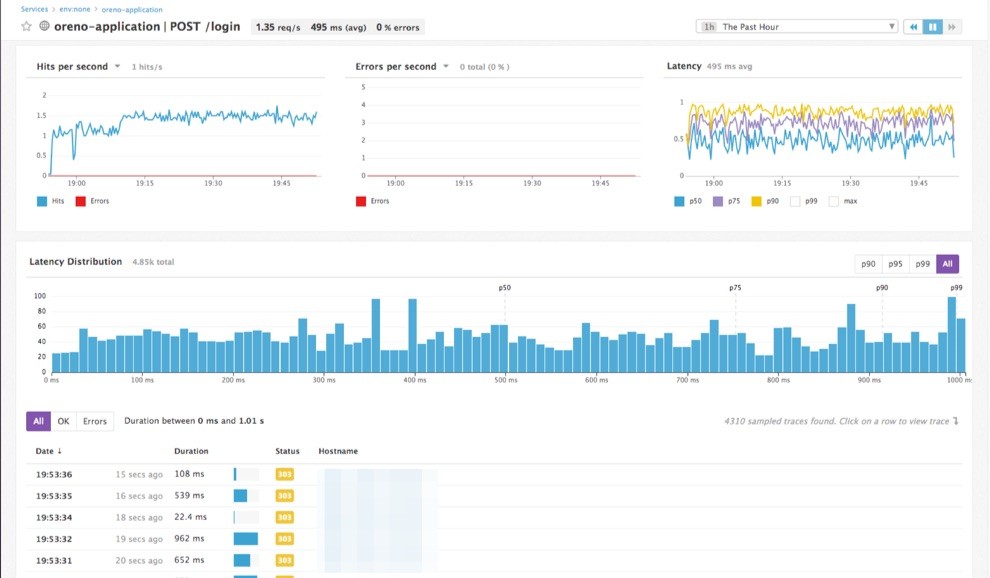
上図の場合だと/login へのアクセスに関するレイテンシ等を確認することが出来る。
最後に
ざっくりと Datadog APM のチュートリアルをしてみて以下のように感じた。
- ちょっとしたコードの追加だけでアプリケーションのパフォーマンスを計測出来るという点では良い
- 既存のインテグレーションよりは一歩踏み込んだ感じ(既存のインテグレーションは自前でメトリクスに必要な数値を生成する必要がある)
まだ、ベータ版なのでこれから色々と改善が加えられていくと思うので、引続き触れる部分は触っていきたいと思うばい。