
NagiosのCloudWatchプラグイン(PHP版)を実際に利用の記事でEC2のCPU使用率が監視できるようになったので、今回はRDSの監視をできるようにします。
RDSで監視する項目は、実装の都合上(後述)下記としています。
CPUUtilization DatabaseConnections SwapUsage
Nagiosのコマンドは、下記のように設定します。
# RDS CPUUtilization
define command {
    command_name    check-cloudwatch-cpu_rds-cloudpack
    command_line    /opt/cloudpack/nagios/check_cloudwatch -f /opt/cloudpack/conf/$HOSTGROUPNAME$/credential.yml -n AWS/RDS -m CPUUtilization -s Average -u Percent -d DBInstanceIdentifier -r ap-northeast-1 -w $ARG1$ -c $ARG2$ -v $ARG3$
}

# RDS DatabaseConnections
define command {
    command_name    check-cloudwatch-connection_rds-cloudpack
    command_line    /opt/cloudpack/nagios/check_cloudwatch -f /opt/cloudpack/conf/$HOSTGROUPNAME$/credential.yml -n AWS/RDS -m DatabaseConnections -s Average -u Count -d DBInstanceIdentifier -r ap-northeast-1 -w $ARG1$ -c $ARG2$ -v $ARG3$
}

# RDS SwapUsage
define command {
    command_name    check-cloudwatch-swap_rds-cloudpack
    command_line    /opt/cloudpack/nagios/check_cloudwatch -f /opt/cloudpack/conf/$HOSTGROUPNAME$/credential.yml -n AWS/RDS -m SwapUsage -s Average -u Bytes -d DBInstanceIdentifier -r ap-northeast-1 -w $ARG1$ -c $ARG2$ -v $ARG3$
}
そのコマンドを利用して、下記のように監視設定をします。
# RDS CPUUtilization
define service {
    use                    suzlab_cloudpack.jp-service
    host_name              suzlab_cloudpack.jp_suzlab-rds
    service_description    cpu_rds
    service_groups         cpu_rds
    check_command          check-cloudwatch-cpu_rds-cloudpack!60!80!suzlab
}

# RDS DatabaseConnections
define service {
    use                    suzlab_cloudpack.jp-service
    host_name              suzlab_cloudpack.jp_suzlab-rds
    service_description    connection_rds
    service_groups         connection_rds
    check_command          check-cloudwatch-connection_rds-cloudpack!50!100!suzlab
}

# RDS SwapUsage
define service {
    use                    suzlab_cloudpack.jp-service
    host_name              suzlab_cloudpack.jp_suzlab-rds
    service_description    swap_rds
    service_groups         swap_rds
    check_command          check-cloudwatch-swap_rds-cloudpack!0!0!suzlab
}
問題がなければ、下記のようにWebの方でも表示されているはずです。
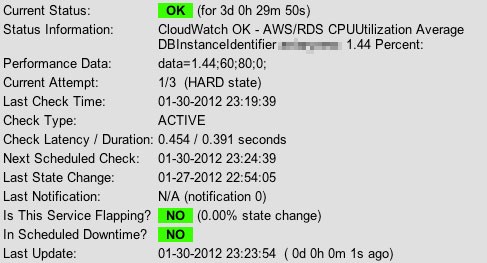
・RDS CPUUtilization
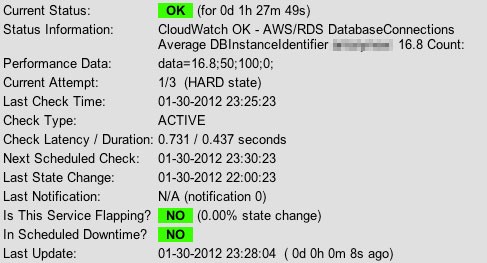
・RDS DatabaseConnections
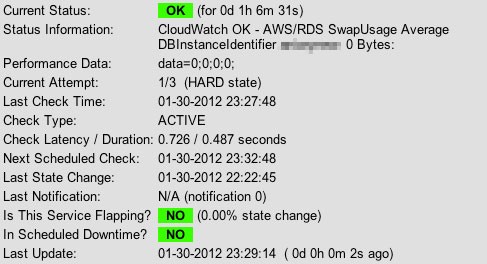
・RDS SwapUsage
因みに、現状のNagiosのCloudWatchプラグインのコードは次のようになっています。
#!/usr/bin/php
require_once("/opt/aws/php/latest/sdk.class.php");

// define status
$ok       = array("code" => 0, "name" => "OK");
$warning  = array("code" => 1, "name" => "WARNING");
$critical = array("code" => 2, "name" => "CRITICAL");
$unknown  = array("code" => 3, "name" => "UNKNOWN");

// set option
$option = getopt("c:w:f:r:n:m:s:u:d:v:");
$critical_size = $option["c"];
$warning_size  = $option["w"];
$credential    = yaml_parse_file($option["f"]);
$region        = $option["r"];
$namespace     = $option["n"];
$metrics       = $option["m"];
$statistics    = $option["s"];
$unit          = $option["u"];
$name          = $option["d"];
$value         = $option["v"];

// init cw
$cw = new AmazonCloudWatch($credential["accessKey"], $credential["secretKey"]);
$cw->set_region($region);
date_default_timezone_set("Asia/Tokyo");

// get metric statistics
$response = $cw->get_metric_statistics(
    $namespace,
    $metrics,
    "-10 minutes",
    "now",
    300,
    $statistics,
    $unit,
    array(
        "Dimensions" => array(
            array("Name" => $name, "Value" => $value)
        )
    )
);
$data = (float)$response->body->GetMetricStatisticsResult->Datapoints->member->$statistics->to_string();

// check status
if($data > $critical_size) {
    $status = $critical["code"];
} elseif($data > $warning_size) {
    $status = $warning["code"];
} elseif($data >= 0) {
    $status = $ok["code"];
} else {
    $status = $unknown["code"];
}

// output status
$output = " - ${namespace} ${metrics} ${statistics} ${name} ${value}: ${data} ${unit};| data=${data};${warning_size};${critical_size};0;";
switch($status) {
    case $ok["code"]:
        print("CloudWatch " . $ok["name"]       . $output);
        exit($ok["code"]);
    case $warning["code"]:
        print("CloudWatch " . $warning["name"]  . $output);
        exit($warning["code"]);
    case $critical["code"]:
        print("CloudWatch " . $critical["name"] . $output);
        exit($critical["code"]);
    case $unknown["code"]:
        print("CloudWatch " . $unknown["name"]  . $output);
        exit($unknown["code"]);
}
print("CloudWatch " . $unknown["name"] . $output);
exit($unknown["code"]);
?>
上記の通り、WarningやCriticalは閾値「より大きい」の場合となっており、RDSにはFreeableMemoryやFreeStorageSpaceと、閾値「より小さい」場合をWarningやCriticalにする項目もありますが、現状は対応できていません。