
はじめに
JMeter のテスト結果を Grafana とかで見れたら幸せになれそうだなーって思っていたら Backend Listener を使えばレスポンスタイムを InfluxDB と Grafana で可視化出来るよーって @muramasa64 さんに教えて貰ったので早速試してみた。
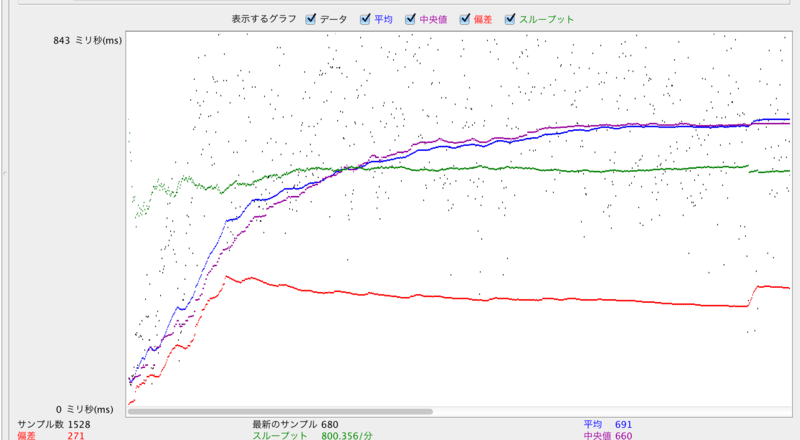
このグラフでも悪くはないんだけど…。
参考
手順
準備
- JMeter 2.13 をダウンロードしてインストール(今回は MacOS X にて試す)
- 負荷を掛ける対象のアプリケーション(PlayFramework)が動いている Docker コンテナを用意
- InfluxDB と Grafana が動く Docker コンテナを用意
Docker コンテナの構成
% docker ps
CONTAINER ID        IMAGE                      COMMAND             CREATED             STATUS              PORTS                                                                                              NAMES
791f50fd1bd9        inokappa/influxdb:latest   "/bin/bash"         About an hour ago   Up About an hour    0.0.0.0:49161->2003/tcp, 0.0.0.0:49162->80/tcp, 0.0.0.0:49163->8083/tcp, 0.0.0.0:49164->8086/tcp   influxdb00
bbce0b40aa88        play-debug:latest          "/bin/bash"         24 hours ago        Up About an hour    0.0.0.0:49153->7000/tcp, 0.0.0.0:49154->9000/tcp                                                   play-debug01
JMeter
スレッドグループのサンプラーで HTTP リクエストを定義。
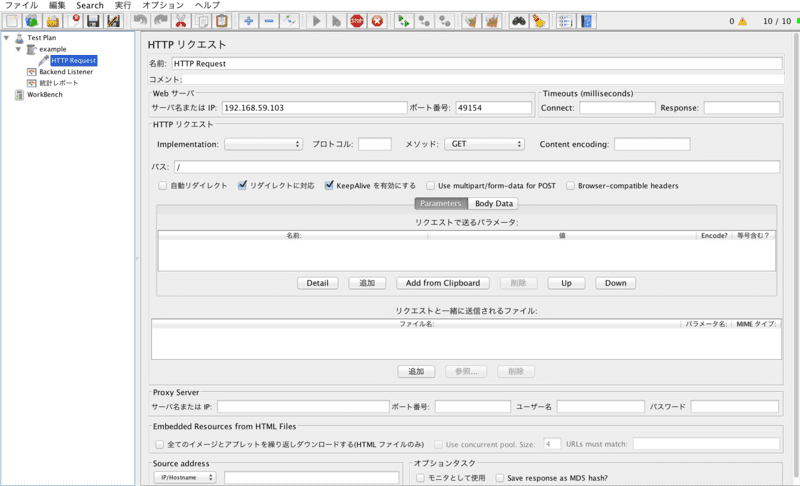
アクセス先のホスト、ポート、パスを指定する。
Backend Lister を有効にする。
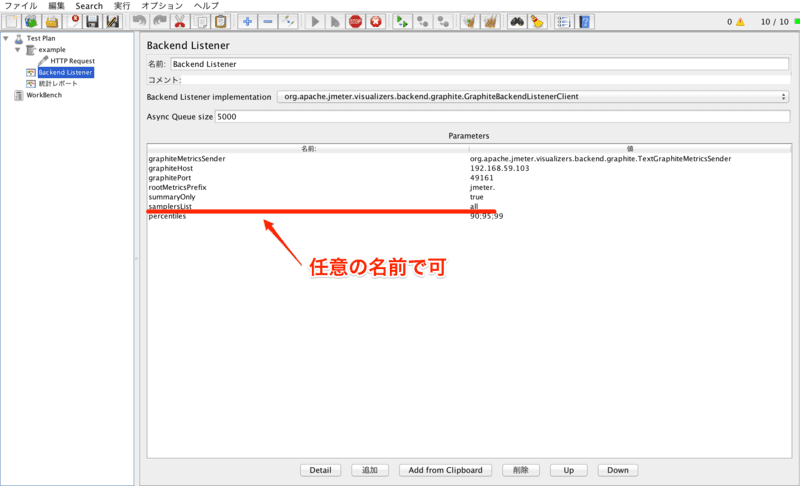
Grafana のホスト、ポートを指定する。
Influxdb
Graphite Input Plugin を有効にして Influxdb を起動しておく。
# diff -u config.toml.bk config.toml
--- config.toml.bk      2015-04-03 22:26:33.000000000 +0000
+++ config.toml 2015-04-03 22:27:05.000000000 +0000
@@ -39,10 +39,10 @@

   # Configure the graphite api
   [input_plugins.graphite]
-  enabled = false
-  # address = "0.0.0.0" # If not set, is actually set to bind-address.
-  # port = 2003
-  # database = ""  # store graphite data in this database
+  enabled = true
+  address = "0.0.0.0" # If not set, is actually set to bind-address.
+  port = 2003
+  database = "jmeter"  # store graphite data in this database
   # udp_enabled = true # enable udp interface on the same port as the tcp interface

   # Configure the collectd api
InfluxDB が起動したら jmeter という名前でデータベースを作成する。
Grafana
今回は grafana-1.9.1 を利用。
# diff -u config.sample.js config.js
--- config.sample.js    2014-12-29 10:25:17.000000000 +0000
+++ config.js   2015-04-03 23:01:35.044415428 +0000
@@ -17,23 +17,21 @@
       */

       // InfluxDB example setup (the InfluxDB databases specified need to exist)
-      /*
       datasources: {
         influxdb: {
           type: 'influxdb',
-          url: "http://my_influxdb_server:8086/db/database_name",
-          username: 'admin',
-          password: 'admin',
+          url: "http://192.168.59.103:49164/db/jmeter",
+          username: 'your_name',
+          password: 'your_pass',
         },
         grafana: {
           type: 'influxdb',
-          url: "http://my_influxdb_server:8086/db/grafana",
-          username: 'admin',
-          password: 'admin',
+          url: "http://192.168.59.103:49164/db/jmeter",
+          username: 'your_name',
+          password: 'your_pass',
           grafanaDB: true
         },
       },
-      */

       // Graphite & Elasticsearch example setup
       /*
実施
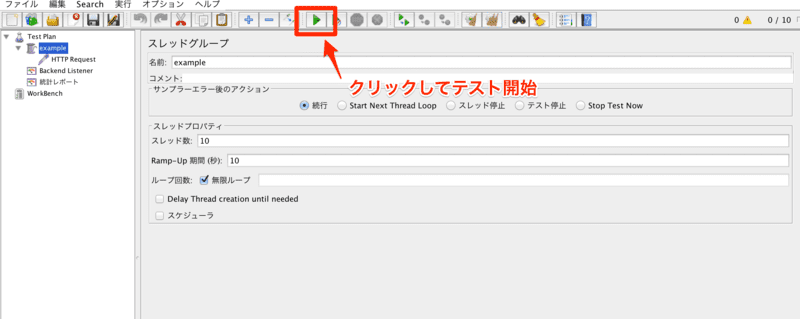
テスト開始
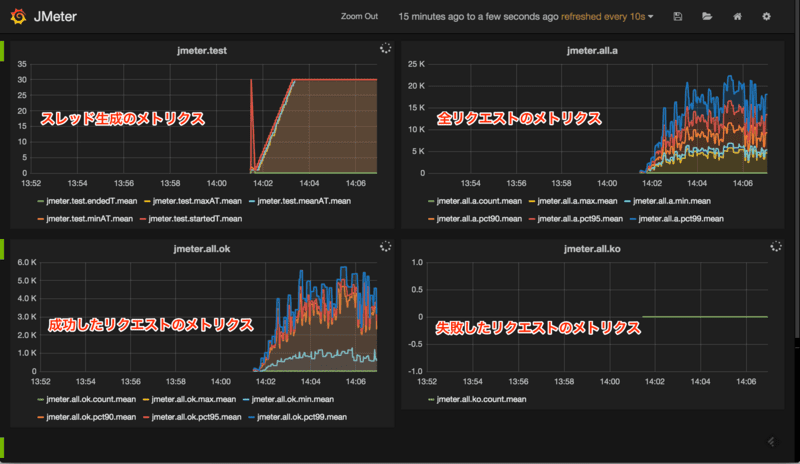
結果
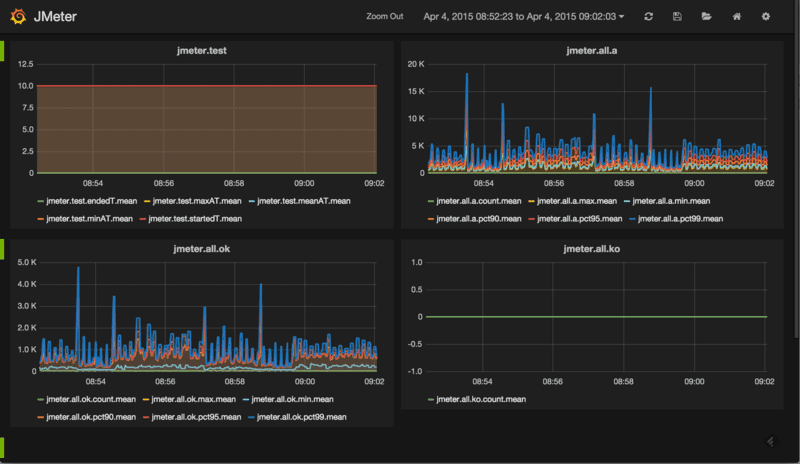
おお。
各メトリクスについては…
上記を転載。
以下、スレッドメトリクス。
| Metric Name | Description |
|---|---|
| [rootMetricsPrefix].test.minAT | Min active threads |
| [rootMetricsPrefix].test.maxAT | Max active threads |
| [rootMetricsPrefix].test.meanAT | Mean active threads |
| [rootMetricsPrefix].test.startedT | Started threads |
| [rootMetricsPrefix].test.endedT | Finished threads |
以下、アクセスに成功したリクエストのレスポンスタイムメトリクス。
| Metric Name | Description |
|---|---|
| [rootMetricsPrefix].[samplerName].ok.count | Number of successful responses for sampler name |
| [rootMetricsPrefix].[samplerName].ok.min | Min response time for successful responses of sampler name |
| [rootMetricsPrefix].[samplerName].ok.max | Max response time for successful responses of sampler name |
| [rootMetricsPrefix].[samplerName].ok.pct[percentileValue] | Percentile computed for successful responses of sampler name. You can input as many percentiles as you want (3 or 4 being a reasonable value). When percentile contains a comma for example “99.9”, dot is sanitized by “_” leading to 99_9. By default listener computes percentiles 90%, 95% and 99% |
以下、アクセスに失敗したリクエストのレスポンスタイムメトリクス。
| Metric Name | Description |
|---|---|
| [rootMetricsPrefix].[samplerName].ko.count | Number of failed responses for sampler name |
| [rootMetricsPrefix].[samplerName].ko.min | Min response time for failed responses of sampler name |
| [rootMetricsPrefix].[samplerName].ko.max | Max response time for failed responses of sampler name |
| [rootMetricsPrefix].[samplerName].ko.pct[percentileValue] | Percentile computed for failed responses of sampler name. You can input as many percentiles as you want (3 or 4 being a reasonable value).When percentile contains a comma for example “99.9”, dot is sanitized by “_” leading to 99_9. By default listener computes percentiles 90%, 95% and 99% |
以下、リクエスト全体のレスポンスタイムメトリクス。
| Metric Name | Description |
|---|---|
| [rootMetricsPrefix].[samplerName].a.count | Number of responses for sampler name |
| [rootMetricsPrefix].[samplerName].a.min | Min response time for responses of sampler name |
| [rootMetricsPrefix].[samplerName].a.max | Max response time for responses of sampler name |
| [rootMetricsPrefix].[samplerName].a.pct[percentileValue] | Percentile computed for responses of sampler name. You can input as many percentiles as you want (3 or 4 being a reasonable value).When percentile contains a comma for example “99.9”, dot is sanitized by “_” leading to 99_9. By default listener computes percentiles 90%, 95% and 99% |
なるほど。
上記のようになる。
ということで
JMeter がとても身近に感じられました。
元記事はこちら
「JMeter の Backend Listener に InfluxDB を使ってレスポンスタイムを Grafana で可視化する」