概要
こんにちわ、新川です。先月に続き、今月もOracle Cloud Infrastructure (OCI) の検証結果をブログにまとめます。今回はIaaSレイヤーに焦点を当てます。
今後の案件では、OCI へ仮想マシン (VM)をリフト&シフトする計画があります。その際に検討、構築が必要となるのがログ管理になります。本記事では、その移行案件を見据えた検証の一環として、OCI のフルマネージドなロギングサービスであるOCI Logging を活用し、OCI Compute インスタンス(Oracle Linux 8) のシステムログやApache のアプリケーションログを安全かつ確実に集約する構築手順を解説します。
前提条件
本記事では、以下の環境がすでに準備されている前提で進めます。
Oracle Cloud アカウントが作成されていること。まだ作成していなければ、以下のブログを参考にアカウントを作成してください。
VCN 作成の手順やログ収集対象となるOCI Compute インスタンスの構築手順は省略します。まだVCN を作成していなければ、以下のブログを参考に作成してください。
Linux の基本的な操作(sudo、systemctl、loggerなど) は説明を省略します。
OCI Logging ログ集約手順 OCI Compute インスタンス(Oracle Linux 8) の準備
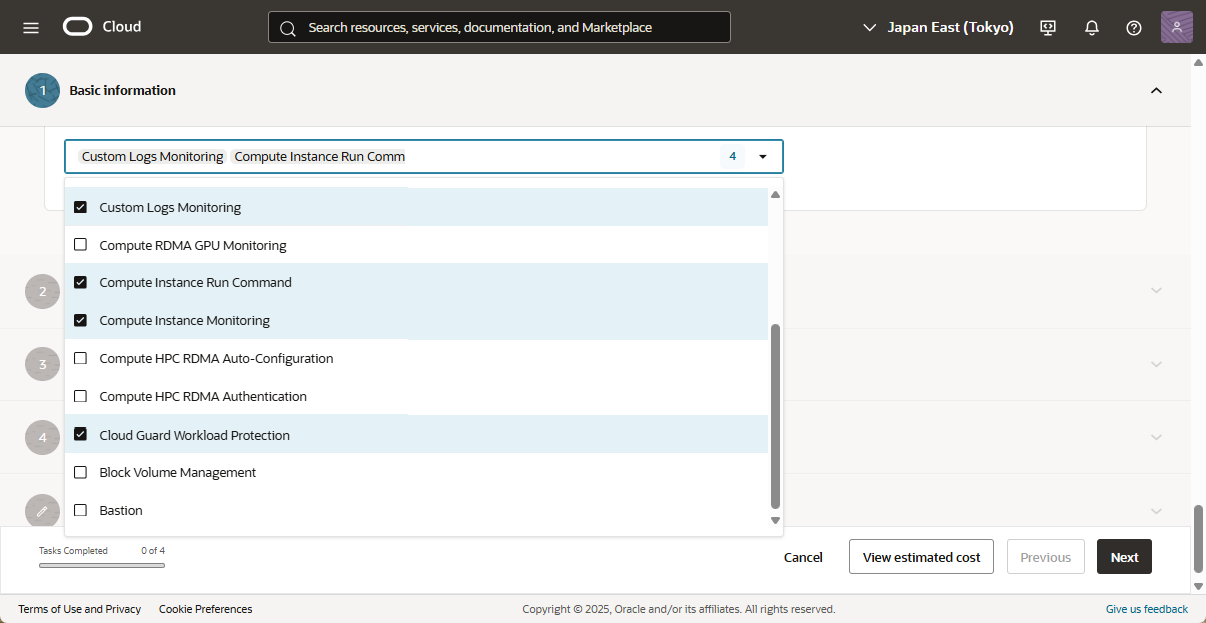
インスタンス(Oracle Linux 8) を起動します。OCIの管理コンソールでインスタンス作成時に、Oracle Cloud Agent に「Custom Logs Monitoring」が選択されていることを確認してください。
以下は、インスタンス作成時の「Oracle Cloud Agent」の設定画面です。デフォルトで、以下のプラグインが選択されています。
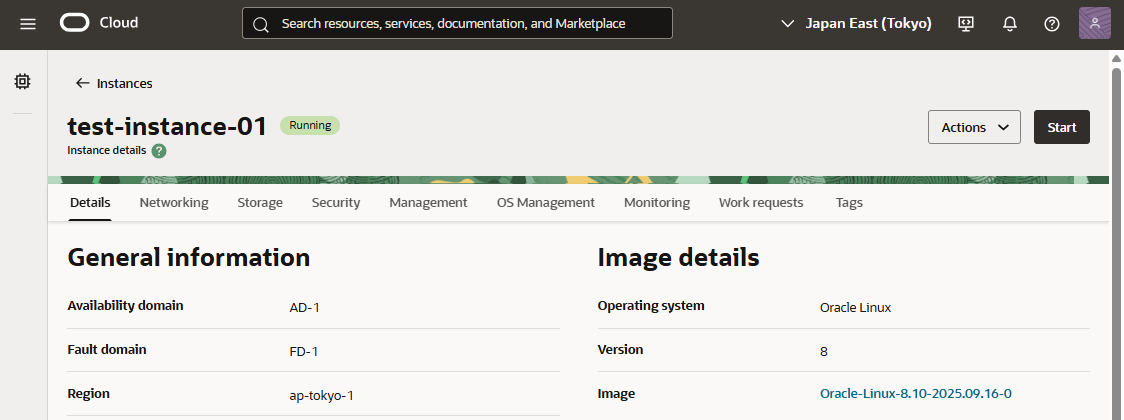
インスタンス(Oracle Linux 8) が起動しました。
インスタンス(Oracle Linux 8) にssh でログインし、テスト環境を準備します。今回の検証には、Oracle Linux のシステムログ、Apache のアクセスログ、エラーログを使用します。
先ずは、httpd のインストールを行います。以下に使用したインストールコマンドを記載します。
次に、curl コマンドでlocalhost へhttpアクセスができること、ログファイルにアクセスログが出力されていることを確認します。
sudo dnf install httpd -y
sudo systemctl start httpd
sudo systemctl enable httpd
systemctl status httpd

echo "Hello Oracle Linux!" | sudo tee /var/www/html/index.html
cat /var/www/html/index.html
curl http://localhost
sudo ls -l /var/log/httpd/*log
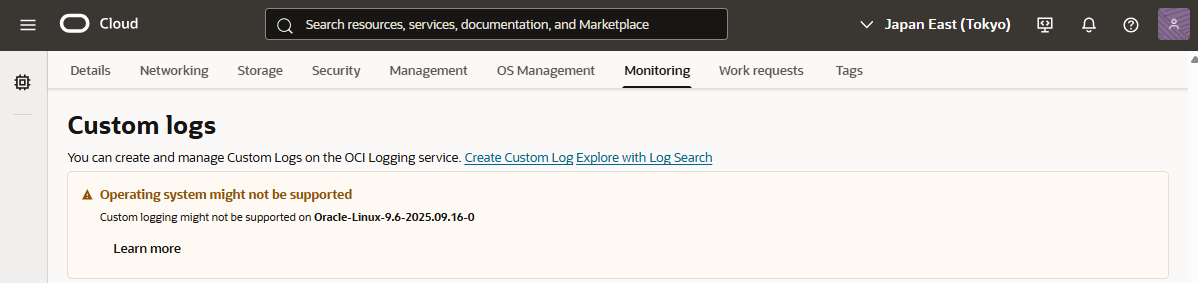
今回の検証は、インスタンスのOS にOracle Linux 8 を使用しています。当初、Oracle Linux 9 を試しましたが、インスタンス起動後、OCI コンソールに「Operating system might not be supported」と表示されたため「Custom Logs Monitoring」がサポートされない可能性を考え、Oracle Linux 8 へ変更しました。なお、Oracle Linux 9 のサポート有無の追加調査は行っていません。
IAM ポリシーの設定
インスタンスに権限を付与するため、IAM ポリシーを設定します。
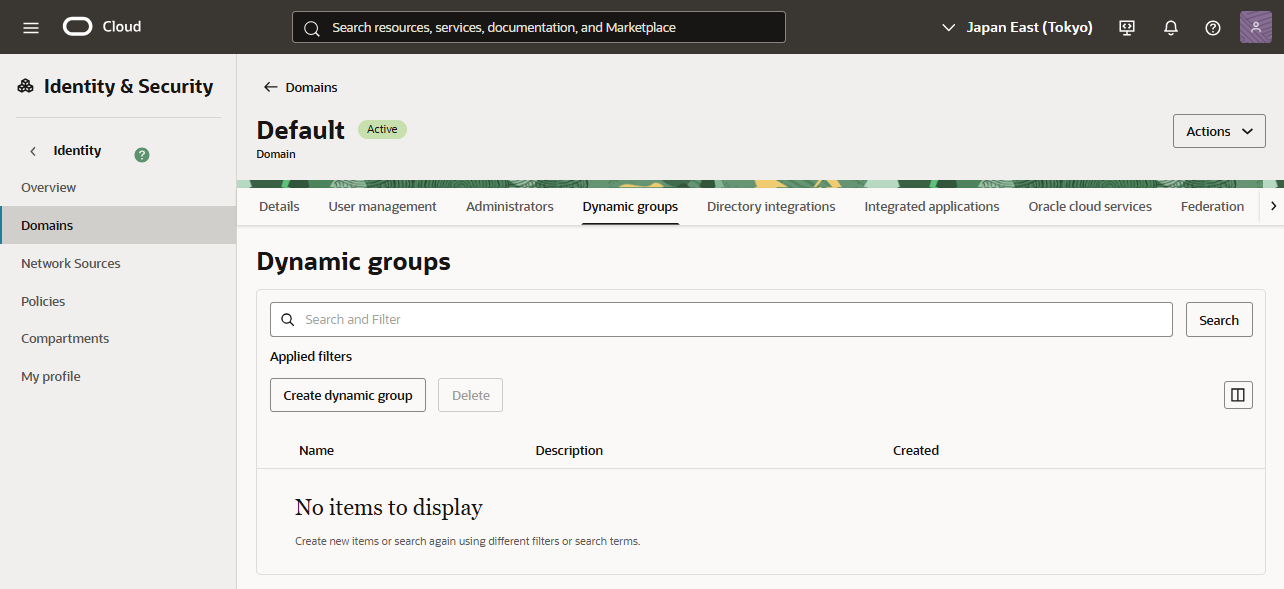
OCIの管理コンソールにて、左ナビゲーションから「Identity & Security」→「Domains」を選択します。Default のDomain を選択します。
「Dynamic groups」を選択します。
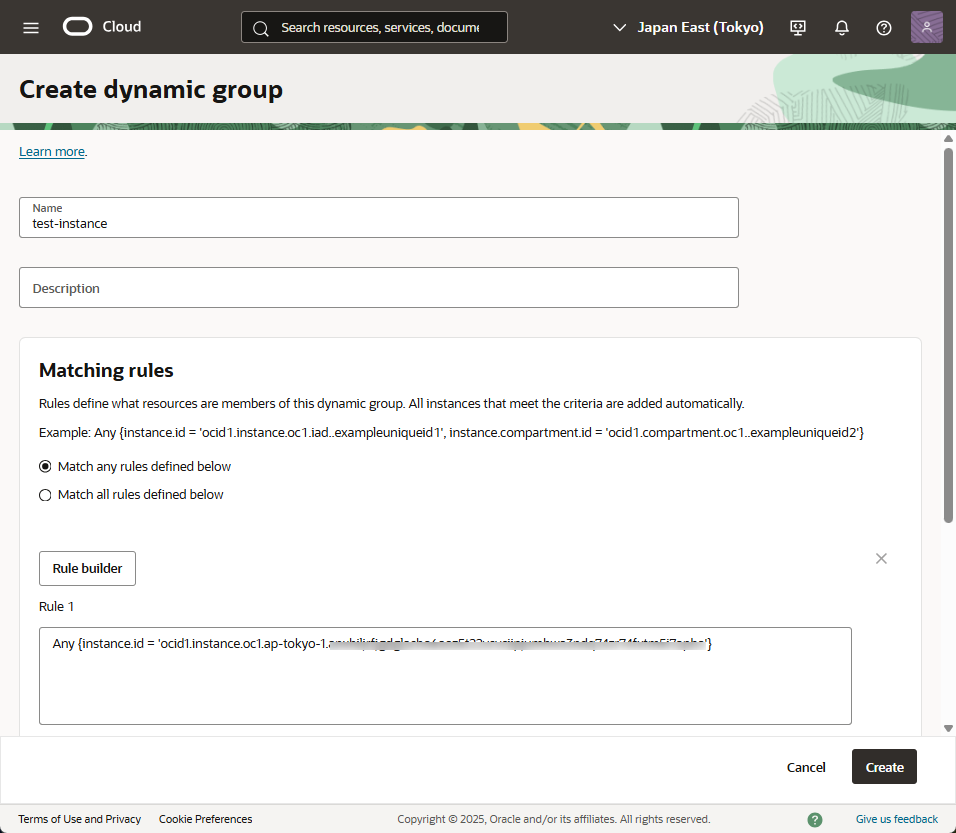
「Create dynamic group」を選択し、「Name」を入力、Matching rules に「Match any rules defined below」を選択します。
「Rule builder」を選択します。
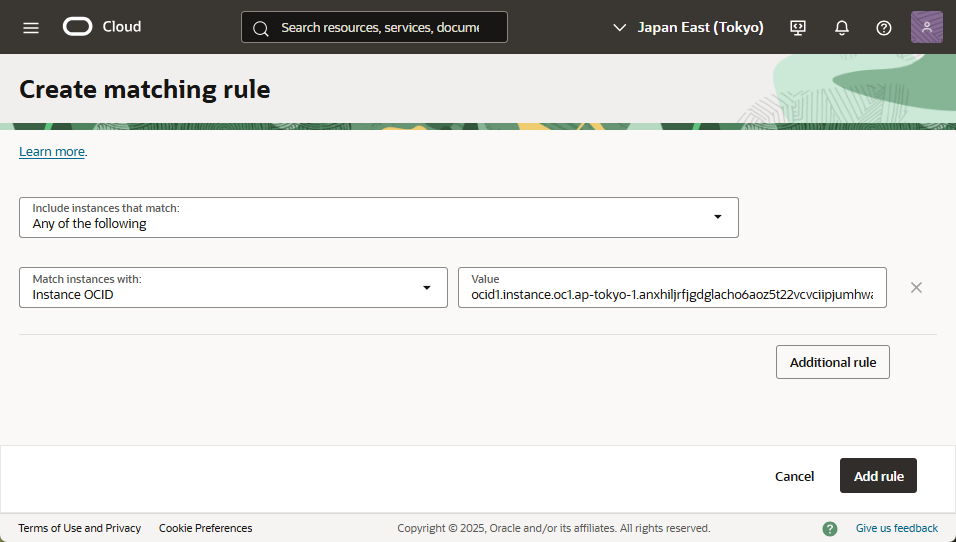
「Include instances that match」に「Any of the following」を選択、「Configuration name」に「Match instances with」に「Instance OCID」を選択、「Value」にインスタンスのOCID を貼り付けます。「Add rule」を選択します。
「Create」を選択し、dynamic group を作成します。
続けて、ポリシーを作成します。左ナビゲーションから「Identity & Security」→「Policies」を選択します。
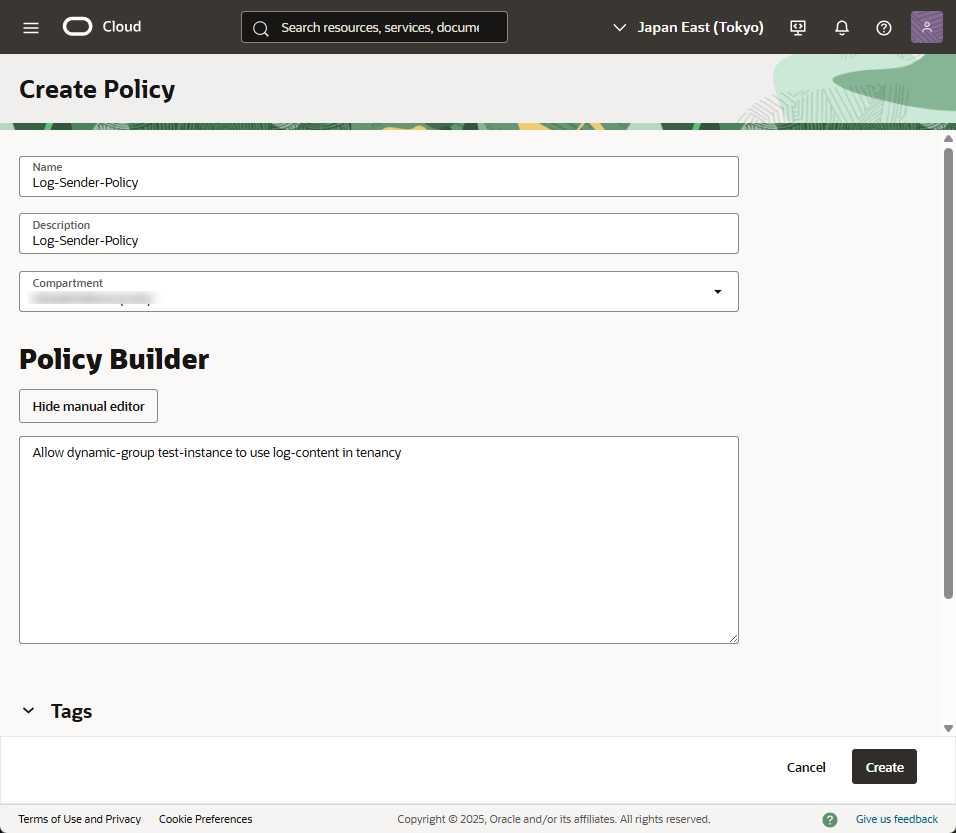
「Create Policy」を選択し、「Name」を入力、「Description」を入力します。
Policy Builderの「Show manual editor」を選択します。
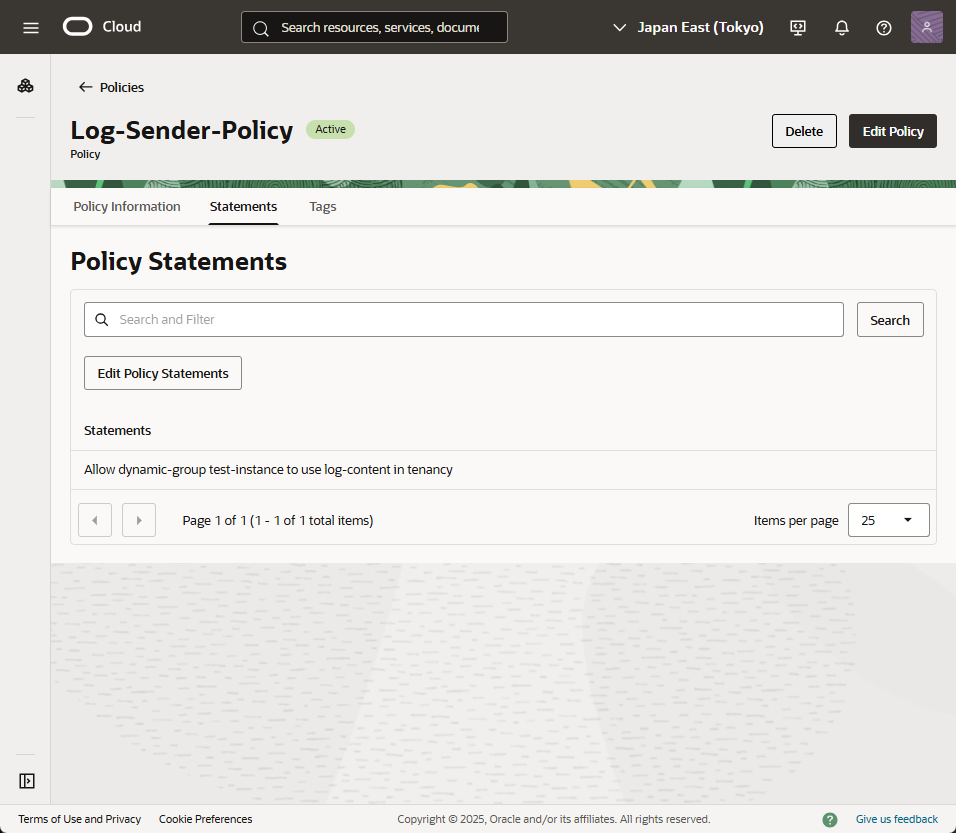
ポリシーのStatement に以下を指定します。dynamic group名には、先ほど作成したdynamic groupの名前を指定します。
Allow dynamic-group [dynamic group名] to use log-content in tenancy
「Create」を選択します。
ロググループ/カスタムログの設定
ロググループ/カスタムログを作成します。
OCIの管理コンソールにて、左ナビゲーションから「Observability & Management」→「Log Groups」を選択します。
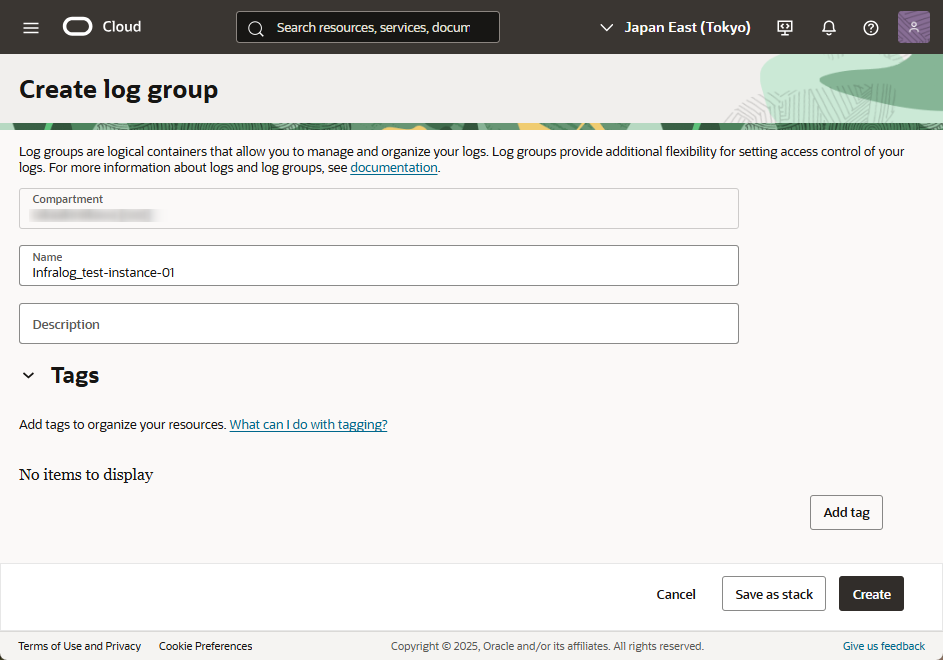
「Create log group」を選択します。
「Name」を入力し、「Create」を選択します。
続けて、左ペインの「Logs」を選択します。
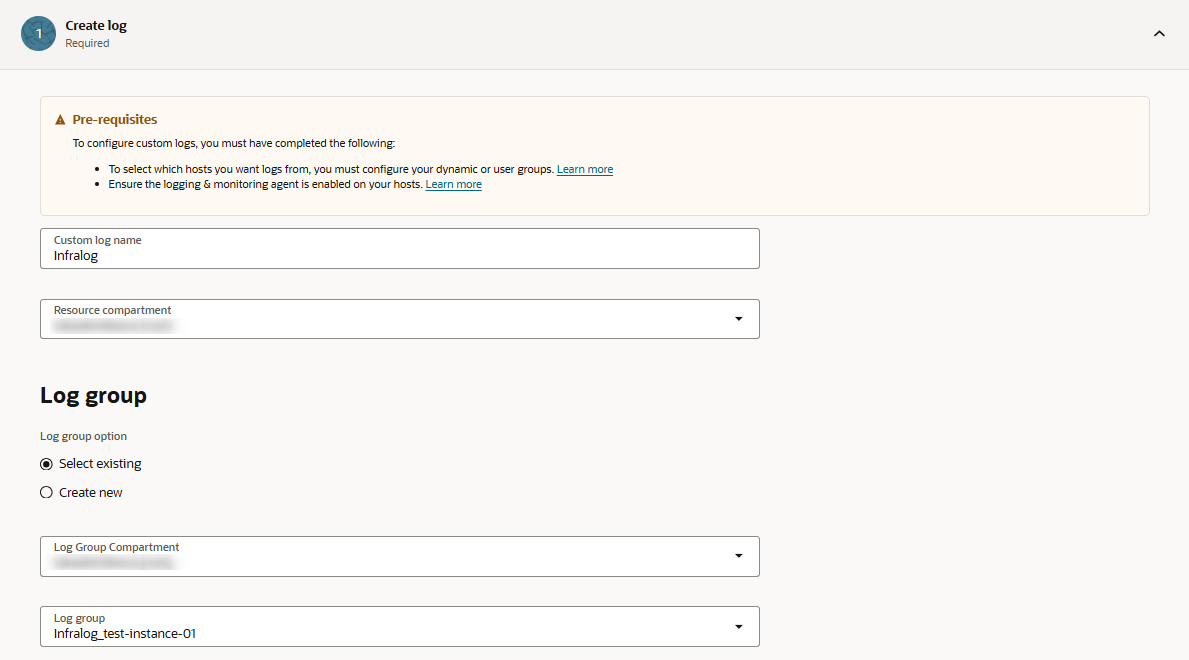
「Create custom log」を選択します。
「Custom log name」を入力、Log group optionに「Select existing」を選択、Log group に先ほど作成したロググループを選択します。
「Next」を選択します。
「Create agent configuration」に「Add configuration later」を選択します。「Next」を選択します。※ここでAdd new configurationを選択した場合、agent configurationの設定が正常に反映されない可能性があるため、Add configuration laterを選択しています。
「Review」の画面で「Create」を選択します。
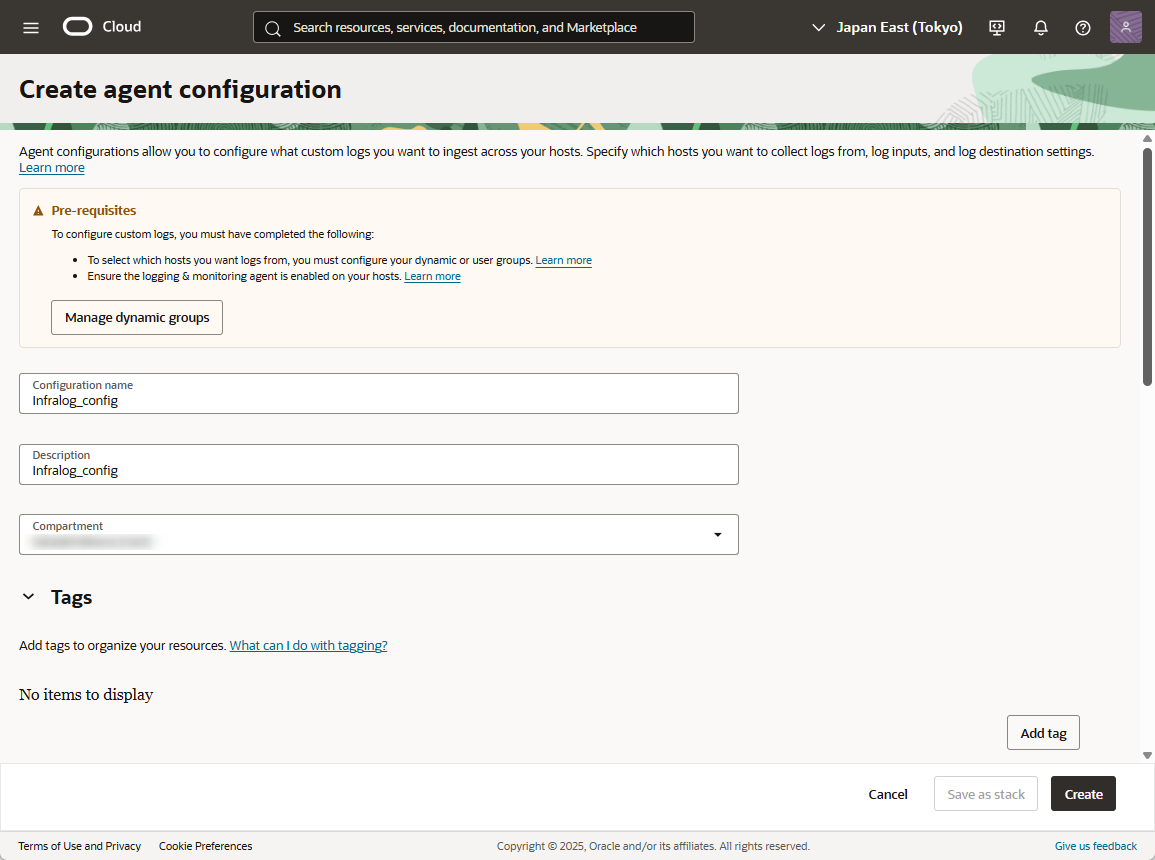
次に作成されたカスタムログを選択し、「Agent configurations」の「Create agent configuration」を選択します。
「Configuration name」、「Description」を入力します。
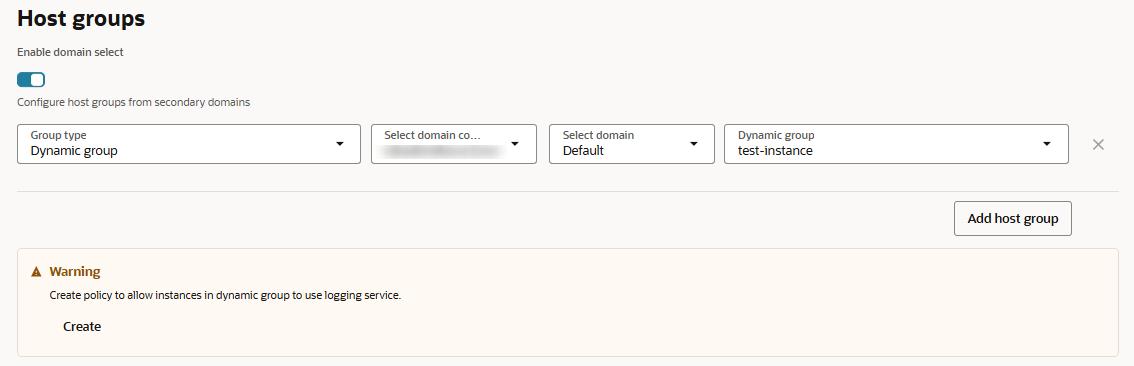
Host groups の「Group type」に「Dynamic group」を指定、「Dynamic group」にIAMポリシーの設定で作成したdynamic group を選択します。以下のようなWarning が出力されますが、問題ありません。
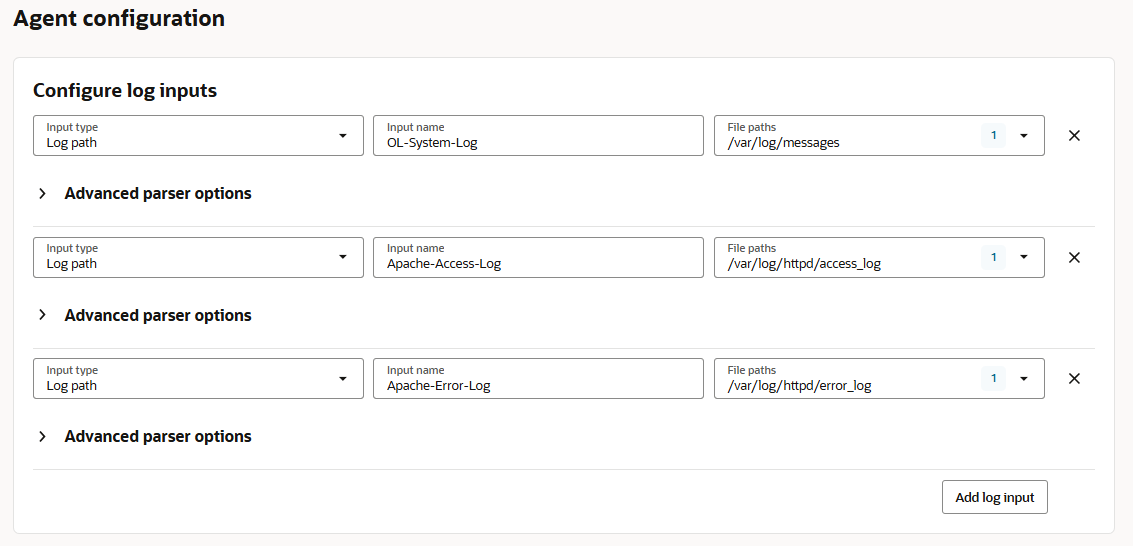
Agent configuration のConfigure log inputs を指定します。
「Input type」、「Input name」、「File paths」を以下の通り入力します。その際にAdvanced parser options の「Parser」は「NONE」を指定しました。
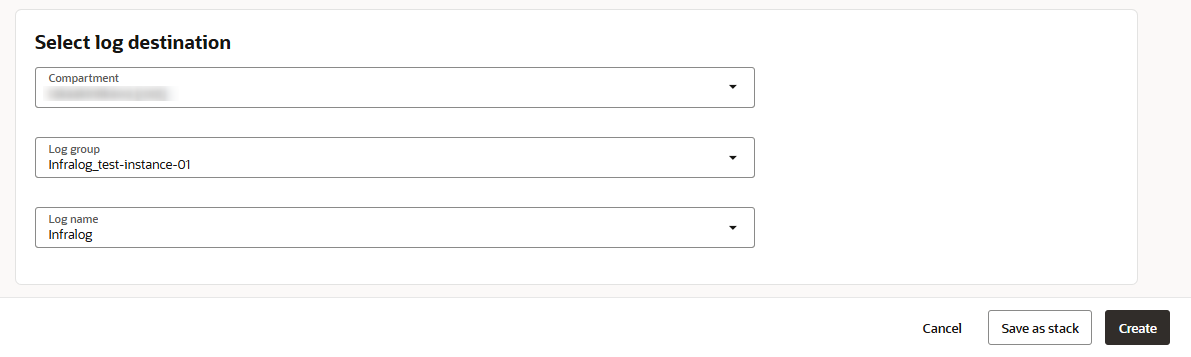
最後に「Log group」、「Log name」を指定して、「Create」を選択します。
ログ出力の確認
curl コマンドでlocalhost へアクセスを行い、アクセスログを出力させます。1行目のコマンドを実行すると「Hello Oracle Linux!」が出力され、2行目のコマンドを実行すると「404 Not Found」が出力される想定です。
curl http://localhost
curl http://localhost/test
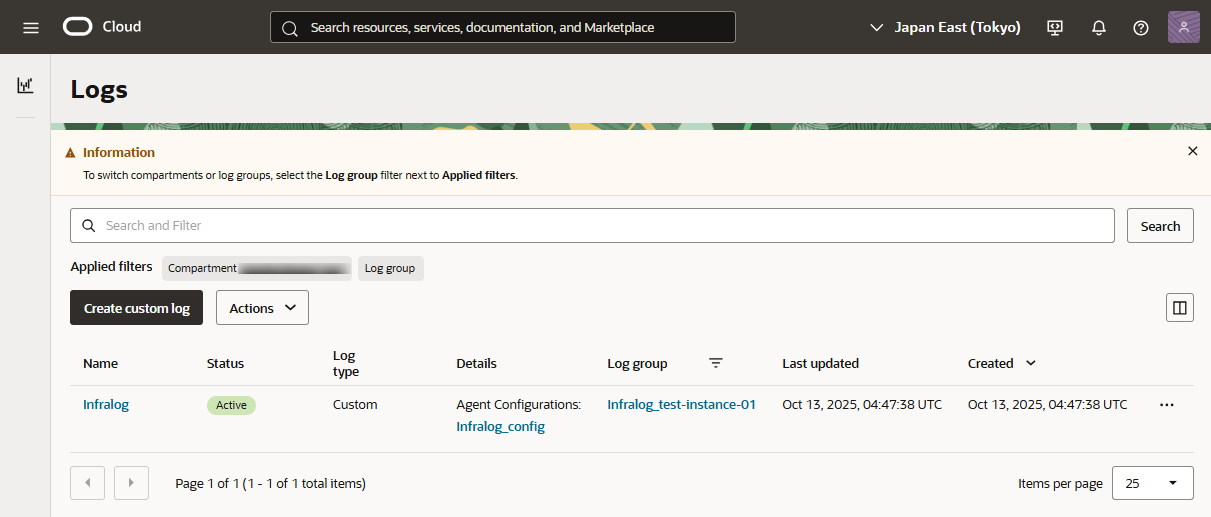
左ペインの「Logs」を選択、作成したカスタムログを選択します。
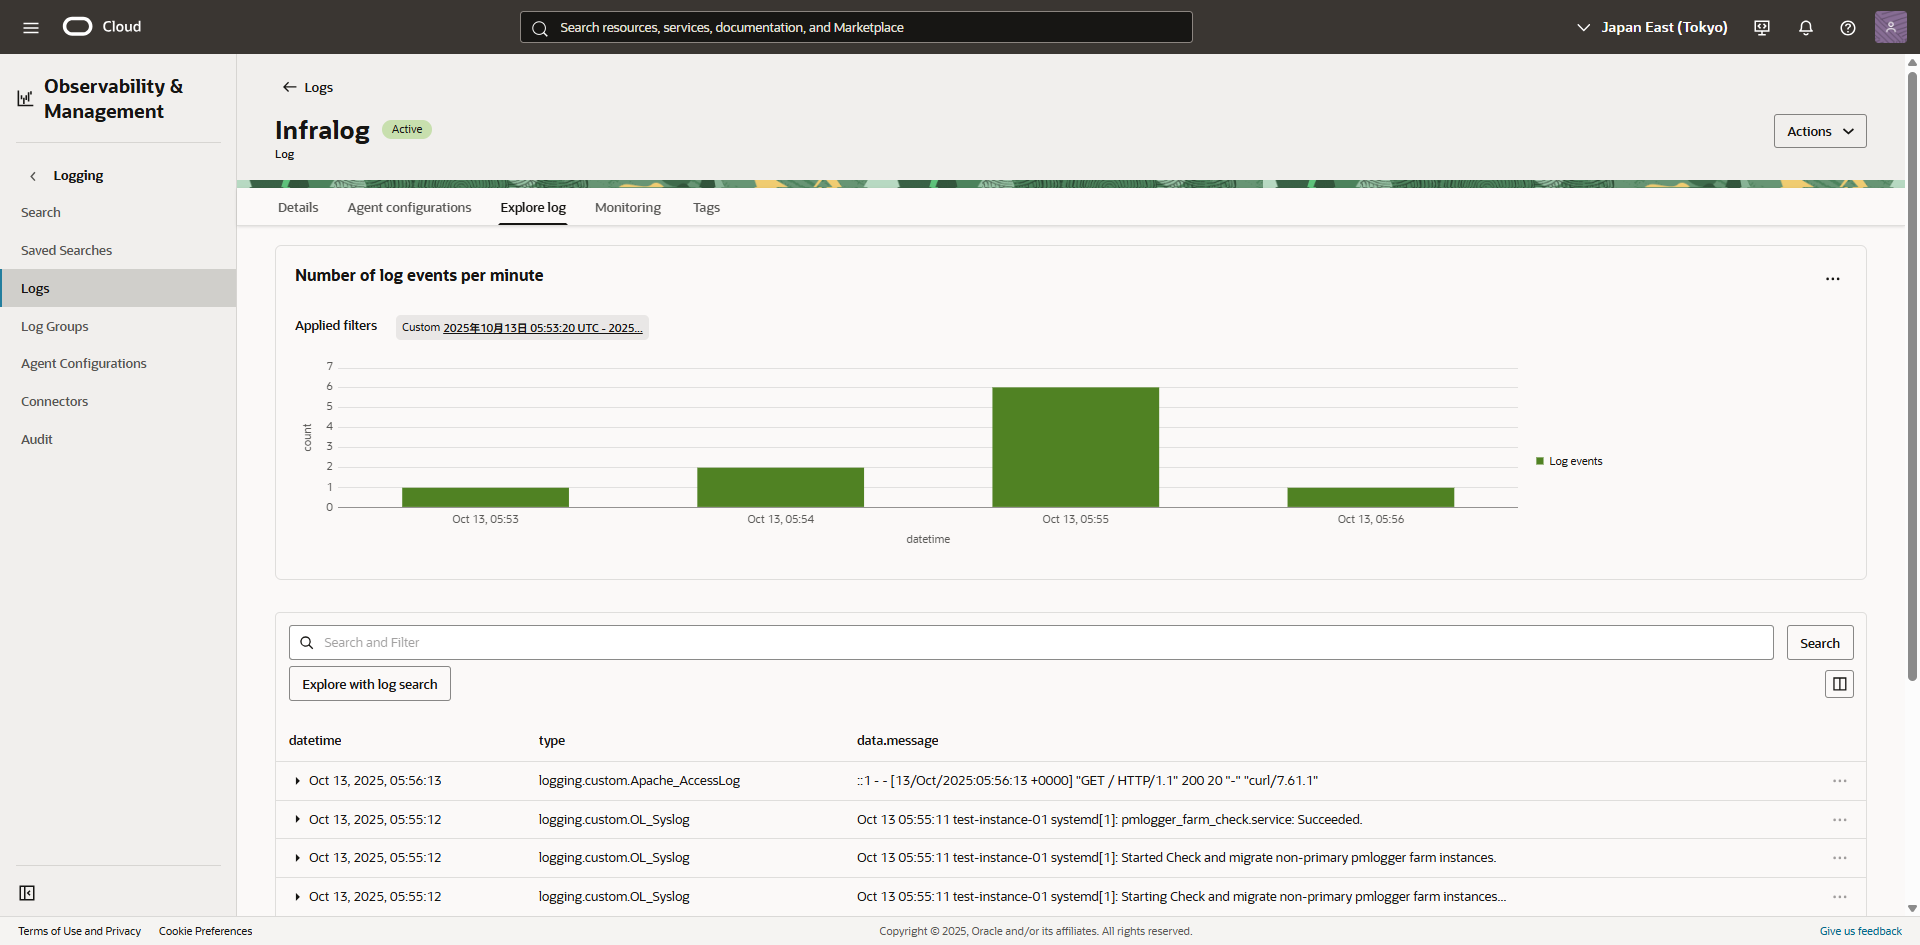
「Explorer log」を選択します。
ログに、OS のシステムログやApache のアクセスログが記録されることを確認します。ログが記録されない場合は、後述のトラブルシューティングを参照ください。
トラブルシューティング1
検証の始めは、Logs にログが出力されませんでした。原因は、Agent configuration でAdvanced parser options の「Parser」が適切な設定ではなかったためです。
以下は、Oracle Linux 8 の/var/log/unified-monitoring-agent/unified-monitoring-agent.log に記載されたログです。以下のwarning が繰り返し出力されており、/var/log/messages のtime フォーマットが一致せずログパースが正しく処理できませんでした。
error=”invalid time format: value = Oct, error_class = ArgumentError, error = string doesn’t match”
Advanced parser options の「Parser」設定において、Time formatを見直すか、デフォルトの「NONE」に変更します。設定を変更後、/var/log/unified-monitoring-agent/unified-monitoring-agent.log には、以下のログが確認できました。
2025-10-13 05:50:16 +0000 [info]: #0 starting fluentd worker pid=49744 ppid=49731 worker=0
2025-10-13 05:50:16 +0000 [info]: #0 following tail of /var/log/httpd/error_log
2025-10-13 05:50:16 +0000 [info]: #0 following tail of /var/log/httpd/access_log
2025-10-13 05:50:16 +0000 [info]: #0 following tail of /var/log/messages
2025-10-13 05:50:16 +0000 [info]: #0 fluentd worker is now running worker=0
トラブルシューティング2
インスタンスが起動した後から、カスタムログのAgent configuration を設定した場合は反映されません。以下のコマンドを実行して、Agent configuration の読み込みを行います。
systemctl status oracle-cloud-agent
sudo systemctl restart oracle-cloud-agent
systemctl status oracle-cloud-agent

systemctl status unified-monitoring-agent
sudo systemctl restart unified-monitoring-agent
systemctl status unified-monitoring-agent
まとめ
本記事では、OCI Logging の基本的な構築方法を理解し、Compute インスタンスからのログ集約を設定しました。これまでオンプレミスであれば、SyslogサーバーやFluentdの構築が必要となりましたが、OCI のマネージドサービスを活用することで、構築・運用負荷が軽減されますね。
次のステップとして、この集約されたログを「検知・通知」する仕組みを構築し、プロアクティブな運用を目指します。
お客様のご要望に柔軟に対応いたします。まずはお気軽にご相談ください。
cloudpack は、KDDIアイレット株式会社が提供するクラウド支援サービスです。クラウドの導入・構築から運用・保守、技術的な問い合わせまでトータルサポート!
KDDIアイレットでは、様々な職種で一緒に働ける仲間を募集しています。
インフラエンジニア、開発エンジニア、クリエイティブ職、営業職など、様々な職種で一緒に働ける仲間を募集しています。KDDIアイレットのこと、社員インタビュー、募集職種、福利厚生など、KDDIアイレット公式サイト採用情報をご覧ください。

![[OCI] OS管理ハブでパッチ適用から再起動まで自動化](https://iret.media/wp-content/uploads/2025/09/Oracle_Cloud-Infrastructure_stacked_rgb20-220x126.png)