概要

  • こんにちわ、新川です。前回のブログ「【OKE入門】ハンズオンで学ぶクラスタ構築からNginx公開まで」では、OKEクラスタを構築し、Nginx アプリケーションを公開するまでをハンズオン形式で解説しました。
  • アプリケーションを公開した次のステップは、その安定運用に必要な「監視」を構築します。CPUやメモリの使用状況、リクエスト数といったシステムの稼働状態を把握するオブザーバビリティ(可観測性)は、問題の早期発見やパフォーマンス改善に欠かせません。
  • 今回のハンズオンでは、Kubernetes 監視のデファクトスタンダードである Prometheus(メトリクス収集)と Grafana(可視化ダッシュボード)をOKE クラスタに導入します。
  • Prometheus はKubernetes との親和性が非常に高く、サービスディスカバリ機能によって新しいPod やサービスを自動で検知し、監視対象に加えてくれます。また、本来は複雑な監視システムの構築も、Helm というパッケージマネージャーを使えば数コマンドで完了し、Grafana のダッシュボードもコミュニティで公開されているものを活用できます。
  • この記事を通じて、OKE クラスタに本格的な監視環境を構築していきましょう。


前提条件


OKE 監視構築のハンズオン

ハンズオン1:Kubernetes のパッケージマネージャーHelmを準備する

  • お使いのUbuntu 環境にHelm をインストールします。
$ which helm
$ curl https://raw.githubusercontent.com/helm/helm/main/scripts/get-helm-3 | bash
  % Total    % Received % Xferd  Average Speed   Time    Time     Time  Current
                                 Dload  Upload   Total   Spent    Left  Speed
100 11913  100 11913    0     0  32237      0 --:--:-- --:--:-- --:--:-- 32197
Downloading https://get.helm.sh/helm-v3.18.6-linux-amd64.tar.gz
Verifying checksum... Done.
Preparing to install helm into /usr/local/bin
[sudo] password for xxxxx:
helm installed into /usr/local/bin/helm

$ which helm
/usr/local/bin/helm


ハンズオン2:Prometheus をデプロイしてメトリクス収集を開始する

  • Helm がPrometheus のインストールパッケージ(Chartと呼ばれます)を見つけられるように、公式コミュニティのリポジトリを追加します。
$ helm repo add prometheus-community https://prometheus-community.github.io/helm-charts
"prometheus-community" has been added to your repositories

$ helm repo update
Hang tight while we grab the latest from your chart repositories...
...Successfully got an update from the "prometheus-community" chart repository
Update Complete. ⎈Happy Helming!⎈


  • Helm を使ってOKE クラスタにPrometheus をインストールします。以下のhelm install コマンドは、Prometheus 本体と、その関連コンポーネントを自動でデプロイします。
    • –namespace monitoring オプションを指定して、監視用のコンポーネントを1つのネームスペースにまとめています。
  • helm install コマンドの実行結果に注目します。「NOTES」にPrometheus serverのDNS名「prometheus-server.monitoring.svc.cluster.local」が出力されています。後ほど、Grafanaから接続する際に使用するアドレスです。
$ helm install prometheus prometheus-community/prometheus --namespace monitoring --create-namespace
Private key passphrase:
NAME: prometheus
LAST DEPLOYED: Sun Sep  7 13:08:14 2025
NAMESPACE: monitoring
STATUS: deployed
REVISION: 1
TEST SUITE: None
NOTES:
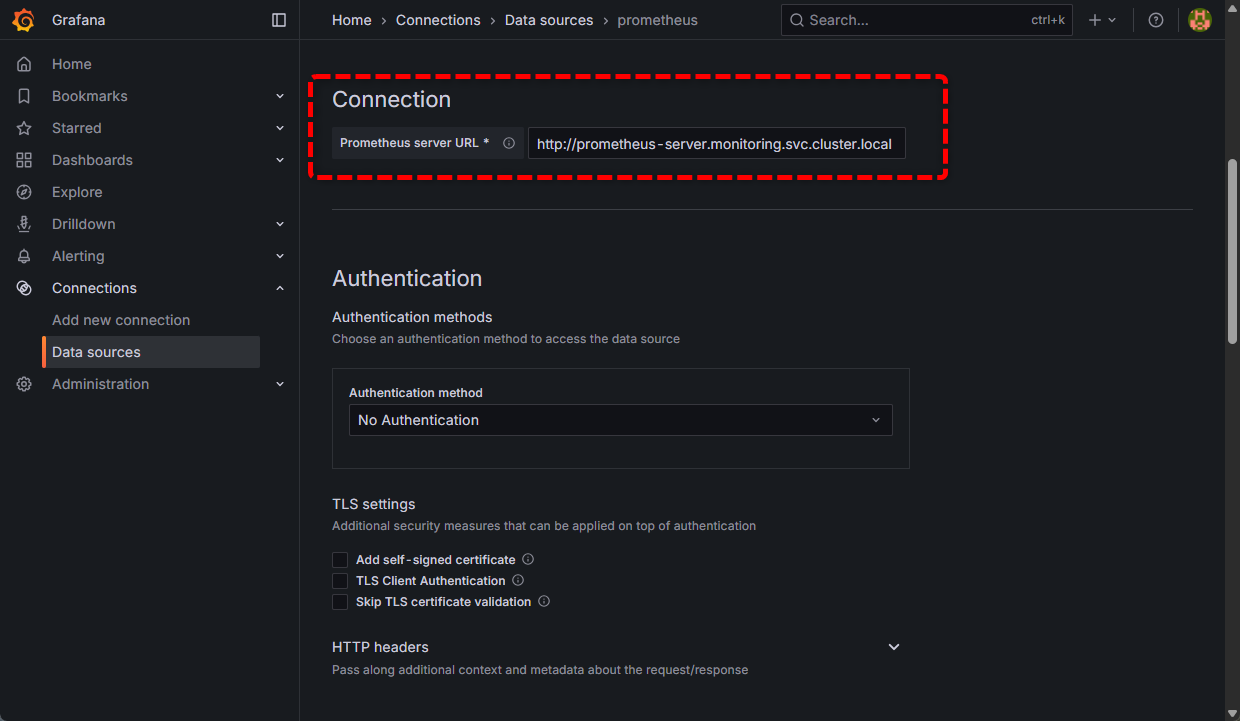
The Prometheus server can be accessed via port 80 on the following DNS name from within your cluster:
prometheus-server.monitoring.svc.cluster.local


Get the Prometheus server URL by running these commands in the same shell:
  export POD_NAME=$(kubectl get pods --namespace monitoring -l "app.kubernetes.io/name=prometheus,app.kubernetes.io/instance=prometheus" -o jsonpath="{.items[0].metadata.name}")
  kubectl --namespace monitoring port-forward $POD_NAME 9090


The Prometheus alertmanager can be accessed via port 9093 on the following DNS name from within your cluster:
prometheus-alertmanager.monitoring.svc.cluster.local


Get the Alertmanager URL by running these commands in the same shell:
  export POD_NAME=$(kubectl get pods --namespace monitoring -l "app.kubernetes.io/name=alertmanager,app.kubernetes.io/instance=prometheus" -o jsonpath="{.items[0].metadata.name}")
  kubectl --namespace monitoring port-forward $POD_NAME 9093
#################################################################################
######   WARNING: Pod Security Policy has been disabled by default since    #####
######            it deprecated after k8s 1.25+. use                        #####
######            (index .Values "prometheus-node-exporter" "rbac"          #####
###### .          "pspEnabled") with (index .Values                         #####
######            "prometheus-node-exporter" "rbac" "pspAnnotations")       #####
######            in case you still need it.                                #####
#################################################################################


The Prometheus PushGateway can be accessed via port 9091 on the following DNS name from within your cluster:
prometheus-prometheus-pushgateway.monitoring.svc.cluster.local


Get the PushGateway URL by running these commands in the same shell:
  export POD_NAME=$(kubectl get pods --namespace monitoring -l "app=prometheus-pushgateway,component=pushgateway" -o jsonpath="{.items[0].metadata.name}")
  kubectl --namespace monitoring port-forward $POD_NAME 9091

For more information on running Prometheus, visit:
https://prometheus.io/


  • Prometheus 関連のPod が起動していることを確認します。STATUS が Running になれば成功です。
$ kubectl get pods --namespace monitoring
Private key passphrase:
NAME                                                 READY   STATUS              RESTARTS   AGE
prometheus-alertmanager-0                            0/1     ContainerCreating   0          34s
prometheus-kube-state-metrics-d4fd85895-gnbgg        1/1     Running             0          34s
prometheus-prometheus-node-exporter-9ptdj            1/1     Running             0          35s
prometheus-prometheus-pushgateway-65ddfcc6c4-69mt9   1/1     Running             0          34s
prometheus-server-949994d9f-7nq2w                    0/2     ContainerCreating   0          34s

$ kubectl get pods --namespace monitoring
Private key passphrase:
NAME                                                 READY   STATUS    RESTARTS   AGE
prometheus-alertmanager-0                            1/1     Running   0          78s
prometheus-kube-state-metrics-d4fd85895-gnbgg        1/1     Running   0          78s
prometheus-prometheus-node-exporter-9ptdj            1/1     Running   0          79s
prometheus-prometheus-pushgateway-65ddfcc6c4-69mt9   1/1     Running   0          78s
prometheus-server-949994d9f-7nq2w                    1/2     Running   0          78s


ハンズオン3:Grafana をデプロイしてPrometheus と連携する

  • 次に、Prometheus が収集したデータを可視化するためのダッシュボードであるGrafana をインストールし、Prometheus をデータソースとして接続します。
  • Helm にGrafanaのリポジトリを追加します。
$ helm repo add grafana https://grafana.github.io/helm-charts
"grafana" has been added to your repositories

$ helm repo update
Hang tight while we grab the latest from your chart repositories...
...Successfully got an update from the "grafana" chart repository
...Successfully got an update from the "prometheus-community" chart repository
Update Complete. ⎈Happy Helming!⎈


  • Grafanaのインストールを行います。Prometheus と同じmonitoring のネームスペースを指定してインストールします。
$ helm install grafana grafana/grafana --namespace monitoring
Private key passphrase:
NAME: grafana
LAST DEPLOYED: Sun Sep  7 13:10:28 2025
NAMESPACE: monitoring
STATUS: deployed
REVISION: 1
NOTES:
1. Get your 'admin' user password by running:

   kubectl get secret --namespace monitoring grafana -o jsonpath="{.data.admin-password}" | base64 --decode ; echo


2. The Grafana server can be accessed via port 80 on the following DNS name from within your cluster:

   grafana.monitoring.svc.cluster.local

   Get the Grafana URL to visit by running these commands in the same shell:
     export POD_NAME=$(kubectl get pods --namespace monitoring -l "app.kubernetes.io/name=grafana,app.kubernetes.io/instance=grafana" -o jsonpath="{.items[0].metadata.name}")
     kubectl --namespace monitoring port-forward $POD_NAME 3000

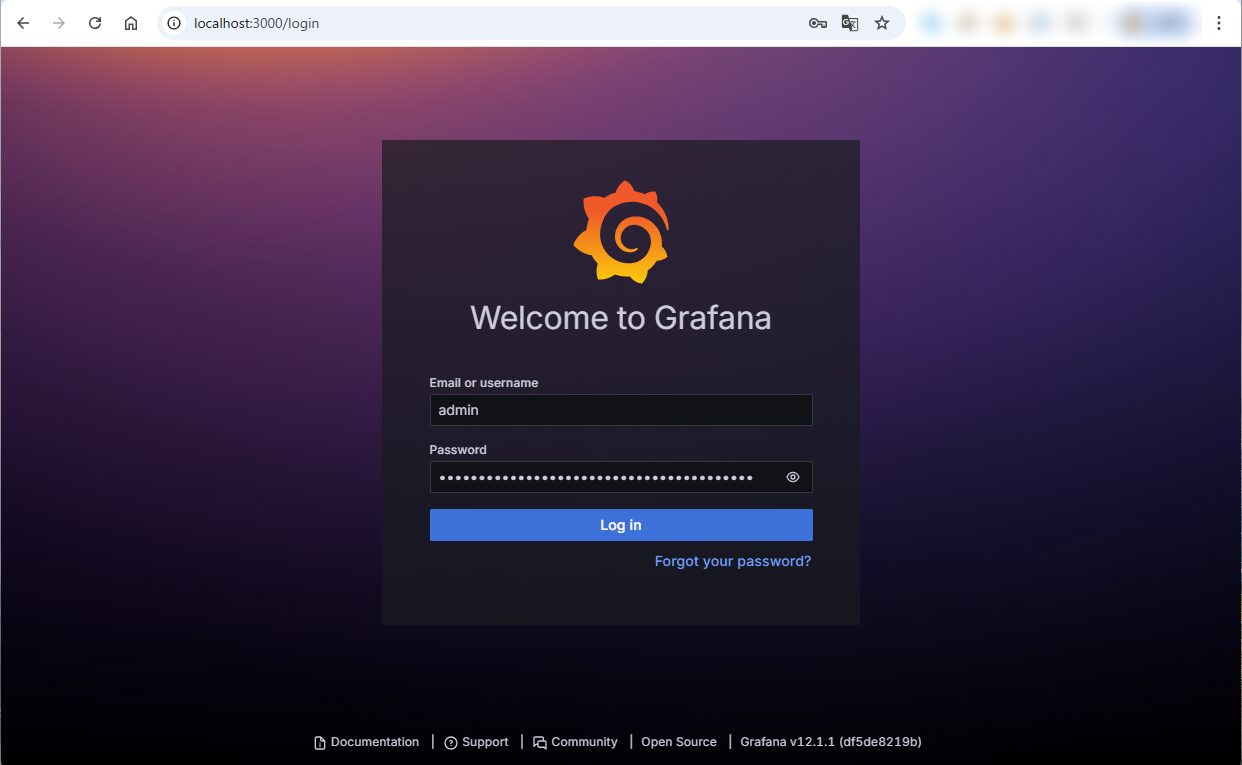
3. Login with the password from step 1 and the username: admin
#################################################################################
######   WARNING: Persistence is disabled!!! You will lose your data when   #####
######            the Grafana pod is terminated.                            #####
#################################################################################


  • インストール時に自動生成された管理者(admin)のパスワードを、以下のコマンドで取得します。
    • 注意:以下の実行結果 XYZ… の部分には、ご自身の環境で生成されたランダムな文字列が表示されます。後でログインに使用するため、控えておいてください。
$ kubectl get secret --namespace monitoring grafana -o jsonpath="{.data.admin-password}" | base64 --decode ; echo
Private key passphrase:
XYZXYZXYZXYZXYZXYZXYZXYZXYZXYZXYZXYZXYZX


  • ローカルPCからGrafana へアクセスします。クラスタ内部で動いているGrafana に安全にアクセスするため、port-forward の機能を使います。
    • このコマンドは、ローカルPCとクラスタの間に一時的なトンネルを作るものです。実行するとプロンプトは返ってきませんが、このターミナルは開いたままにして、ブラウザでの作業を進めてください。
$ export POD_NAME=$(kubectl get pods --namespace monitoring -l "app.kubernetes.io/name=grafana,app.kubernetes.io/instance=grafana" -o jsonpath="{.items[0].metadata.name}")
Private key passphrase:

$ echo $POD_NAME
grafana-7778cdc4c-p5scz

$ kubectl --namespace monitoring port-forward $POD_NAME 3000
Private key passphrase:
Forwarding from 127.0.0.1:3000 -> 3000
Forwarding from [::1]:3000 -> 3000
Handling connection for 3000


ハンズオン4:ダッシュボードでクラスタの状態を可視化する

  • この状態で、Webブラウザを開き、「http://localhost:3000」にアクセスします。
  • ブラウザにGrafana のログイン画面が表示されたら、以下でログインします。
    • User:admin
    • Password:ハンズオン3 の手順で取得したパスワード


  • ログインできました。以下は、Home 画面です。


  • 左側メニューの「Connections」→「Data sources」をクリックします。
  • 「Prometheus」を選択します。


  • Connection の「Prometheus server URL」に以下を入力します。ハンズオン2 のhelm install コマンドの実行結果で出力されたアドレスです。
    • http://prometheus-server.monitoring.svc.cluster.local


  • 一番下にある「Save & test」ボタンをクリックします。


  • Grafanaの上部の「+」アイコン →「Import dashboard」をクリックします。


  • Kubernetes モニタリング用のメジャーなDashboard であるID「15757」を入力し、Loadボタンをクリックします。


  • 次の画面の一番下にある選択ボックスで、先ほど設定したデータソース(Prometheus)を選び、Importボタンをクリックします。


  • インポートが完了すると、自動的にダッシュボードが表示されます。OKE クラスタのCPU 使用率、メモリ使用量、ノードやPod の状態がリアルタイムでグラフ表示されていることを確認しましょう。


まとめ

  • このハンズオンを通じて、OKE クラスタ上にPrometheus とGrafana による本格的な監視環境を構築し、クラスタの稼働状況を可視化するまでの一連の流れを経験しました。コマンドラインだけでは把握しきれないリソースの動的な変化を、グラフィカルなダッシュボードで直感的に理解できるようになったと思います。
  • アプリケーションをサービス提供するうえで、監視は避けて通れません。今回Kubernetes の標準ツールに触れることができました。このダッシュボードが出発点となり、次は自分でパネルをカスタマイズしたり、「CPU使用率が90%を超えたら通知する」といったアラートを設定したりと、よりプロアクティブな運用を目指すことができます。ぜひここから、OKEでの本格的なアプリケーション運用を広げていきましょう。